 Zůstat
Obchodní podmínky
Nástroje


EUR/USD hourly chart
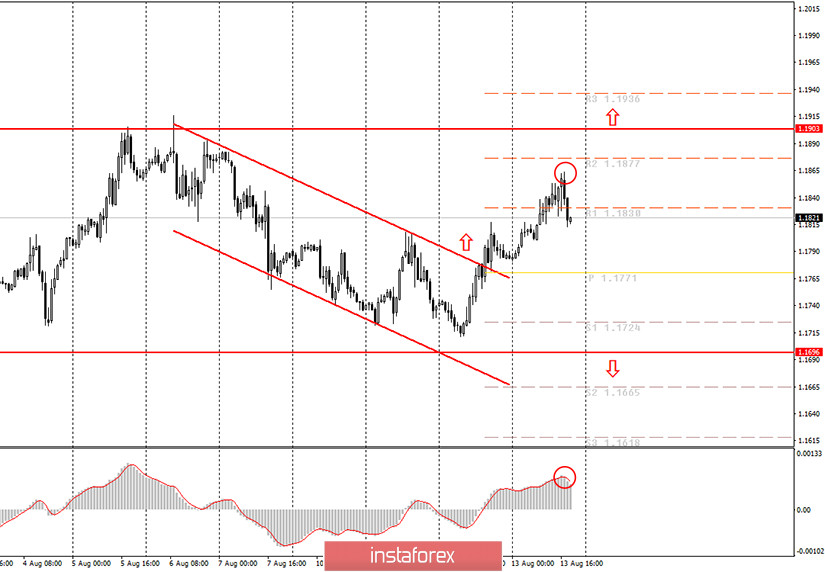
On Thursday, August 13, The EUR/USD currency pair continued its upward movement which started on Tuesday. In the morning analytics, we suggested a much stronger downward correction. Yet, the price was just 30 pips down. However, even this minor correction in the early hours was not shown by the MACD indicator. That is, the MACD indicator did not turn down either at night or in the morning session. Both the indicator histogram and the signal line moved down a bit. But the histogram below the line did not disappear, so there was no signal to sell or close the deals. Thus, novice traders could easily keep their long deals open. Unfortunately, today at the New-York trading session, there was a sharp reversal to the downside, and the MACD indicator reacted to it with a delay. Thus, most of the profit on buy deals was lost due to this decline. The price also failed to reach the second resistance level of 1.1877.
From a fundamental point of view, on Thursday beginners could pay attention to one report only which is the number of jobless claims in the US. For the first time in several months, this report showed less than one million new initial claims. The number of re-applications for the benefits, which is believed to reflect the real number of unemployed people, fell to 15.5 million. It was these two reports that supported the US currency in the afternoon. Indeed, the US dollar managed to advance, but by just 40 pips. We expected that this report would be ignored by traders since much more important macroeconomic news had been shrugged off a day earlier.
Several more important reports are expected on August 14 in the European Union and the US. We would strongly recommend that new traders who trade intraday focus on them. The EU will publish the data on the Gross Domestic Product for the second quarter. The forecast is -12.1% compared to the first quarter. If this reading exceeds estimates, that is, the reduction of the GDP is steeper, then the US dollar may start to rise after the publication. Otherwise, if the reading shows better results, then the euro may start to gain ground. In the US, a report on retail sales will be published. They are expected to grow by 1.9% m /m in July. Two similar reports will also be released: retail control group and retail sales excluding cars. All three indicators need to be analyzed together. Larger-than-expected estimates will again support the US dollar, leading to a fall in the EUR/USD pair. It is also worth paying attention to the report on industrial production and the consumer confidence index from the University of Michigan.
Possible scenarios for August 14:
1) Long deals on the pair are still relevant as the price has settled above the downward channel. Thus, at this time, we recommend considering long positions with the targets at 1.1877 and 1.1903. Now, however, a downward correction has begun. So, you need to wait for its completion and the moment when the MACD indicator points to the upside. Only then can you place long deals.
2) Short positions on the currency pair have become irrelevant since the price has left the downward channel. Thus, in general, the pair is holding within the sideways channel of 1.1696 - 1.1903 where the upward movement continues. This does not mean that from current positions the price cannot move back to 1.1696. This means that there is a signal for an upward trend, which should be taken into account.
On the chart:
Support and Resistance Levels are the Levels that serve as targets when buying or selling the pair. You can place Take Profit near these levels.
Red lines are the channels or trend lines that display the current trend and show in which direction it is preferable to trade now.
Up/down arrows show where you should sell or buy after reaching or breaking through particular levels.
The MACD indicator consists of a histogram and a signal line. When they cross, this is a signal to enter the market. It is recommended to use this indicator in combination with trend lines (channels and trend lines).
Important announcements and economic reports (you can always find them in the news calendar) can seriously influence the trajectory of a currency pair. Therefore, at the time of their release, it is recommended to trade as carefully as possible or exit the market in order to avoid a sharp price reversal.
Beginners in the Forex market should remember that not every single trade should be profitable. The development of a clear strategy and money management are the key to success in trading over a long period of time.
Díky analytickým přehledům společnosti InstaForex získáte plné povědomi o tržních trendech! Jako zákazníkovi společnosti InstaForex je Vám k dispozici velký počet bezplatných služeb umožňujících efektivní obchodování.

