 Zůstat
Obchodní podmínky
Nástroje


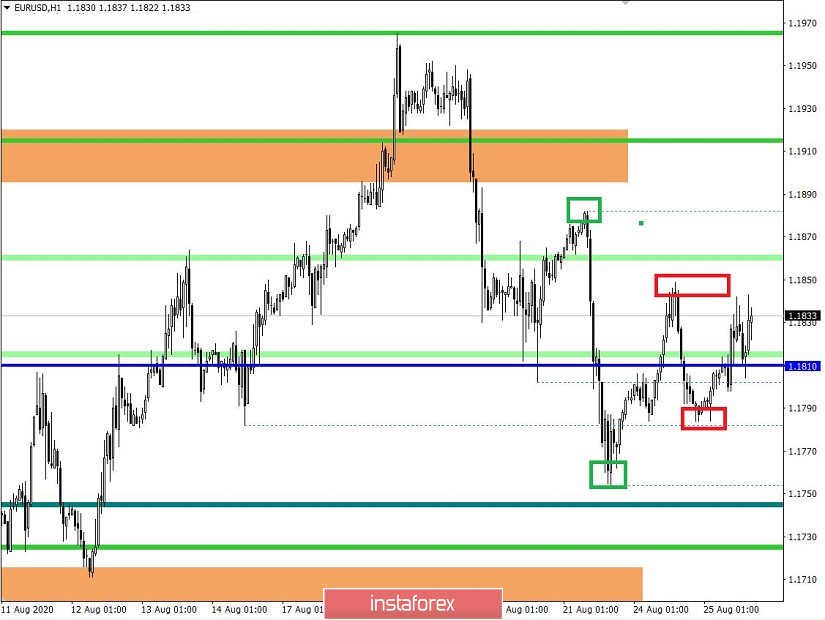
EUR/USD has been trapped in the range of 1.1700//1.1810//1.1910. The price has come to the median level of around 1.1810 where it is fluctuating in the narrow range of 1.1784/1.1850.
A halt at the median level could signal the lull before the storm. In other words, the price could start gyrating in the short term. The pair will hardly escape its trading range but the price is likely to make sharp swings towards both upper and lower borders.
So, it would be a good trading idea to trade on local price swings excluding broader trends.
Scrutinizing the trading day today on a 30-minute chart, I see a V-shaped pattern with a minor dynamic. According to the open interest in the COT reports, long positions were opened in the period 07:00-14:30. Short deals were prevailing in the period 15:00-23:00.
In terms of an intraday dynamic, the price dynamic is 24% lower than an average dynamic of EUR/USD. Importantly, the currency pair was trading with extreme volatility on August 21. So, a consequent slowdown is the common case.
In the previous market review, I offered a scheme of a plausible further move which exactly coincided with the actual market development. First, the price retraced towards 1.1840/1.1850 with the same dynamic than on August 20. At the levels of 1.1840/1.1850 the price stalled as expected. As a result, the price pulled back towards 1.1810/1.1800.
Considering the daily chart, it is clear that the momentum dynamic from early July is taking the back seat. The currency pair is gradually stalling its move with the ultimate target at 1.1900/1.2000.

The economic calendar today was scarce in macroeconomic reports from Europe and the US.
As for the EU, Germany reported its second Q2 GDP estimate which slightly surpassed expectations. The economy slumped to -11.3% in Q2 sequentially from -2.2% in Q2. The contraction was a bit more moderate than the first estimate of -11.7%. Nevertheless, the extent of the slump is enormous.
In the New York trade, traders got to know data on new home sales for the US. The volume of new home sales spiked 13.9% in July, much stronger than the expected 1.3% gain. The sales for the previous month were also upgraded to 15.1% from 13.8% in the estimate.
Oddly enough, the market gave no response to such upbeat data.
Further developments
Analyzing the 30-minute chart, I can spot another V-shaped pattern, this time it looks bullish. Bearing in mind, low volatility the price is fluctuating in a narrow range of around 1.1810.
In this situation, the best trading strategy would be to trade from the lower border of the range (1.1784) or from the upper border (1.1850). In this case, we have got a minor price move which will not cause a dramatic change in the market but will give us an opportunity of making a fast profit with low risks.
Based on the above-said information, let me give you the following trading recommendations:
-Short positions could be planned from below 1.1784 towards 1.1755 that is the low of August 21. The next long position will depend on whether bears will be able to cross 1.1750. The key target level is 1.1700.
-Long positions could be considered from above 1.1860 towards 1.1882 that is a high of August 21. The next long move will depend on whether bulls will be able to break 1.1885. The key target is 1.1900.
Indicator analysis
Reckoning different timeframes, we see that technical indicators on both minute and hour-timeframes coincide in trajectory. The daily timeframe is generating a weak buy signal.
Volatility per week. Volatility measure per month, quarter, and year
Volatility is measured in terms of average daily price fluctuation. It could be measured per month, quarter, and year.
Volatility as for August 25, 2020
Volatility today is measured at 59 points that is 31% lower than an average level. Volatility could increase on condition that the price will be able to rebound or break the trading range.
Key levels
Resistance levels: 1.1910**; 1.2000***; 1.2100*; 1.2450**; 1.2550; 1.2825
Support levels: 1.1800; 1.1650*; 1.1500; 1.1350; 1.1250*;1.1180**; 1.1080; 1.1000***; 1.0850**;1.0775*; 1.0650 (1.0636); 1.0500***; 1.0350**; 1.0000***
* Periodic levels
** Levels of trading range
*** Psychological levels
Díky analytickým přehledům společnosti InstaForex získáte plné povědomi o tržních trendech! Jako zákazníkovi společnosti InstaForex je Vám k dispozici velký počet bezplatných služeb umožňujících efektivní obchodování.

