 Zůstat
Obchodní podmínky
Nástroje


The pair continued to increase last week, but failed to reach the last upper fractal - 1.1965 (red dotted line). As it declined, the price tested the pullback level of 14.6% - 1.1770 (red dotted line). This week, the market may continue to grow.
Trend analysis.
This week, the price from the level of 1.1903 (closing of the last weekly candle) may continue to grow with the target at 1.1965 - the upper fractal (red dotted line). Upon reaching this line, it is possible to continue working upwards with the target of 1.2101 - the pullback level of 76.4% (blue dotted line).
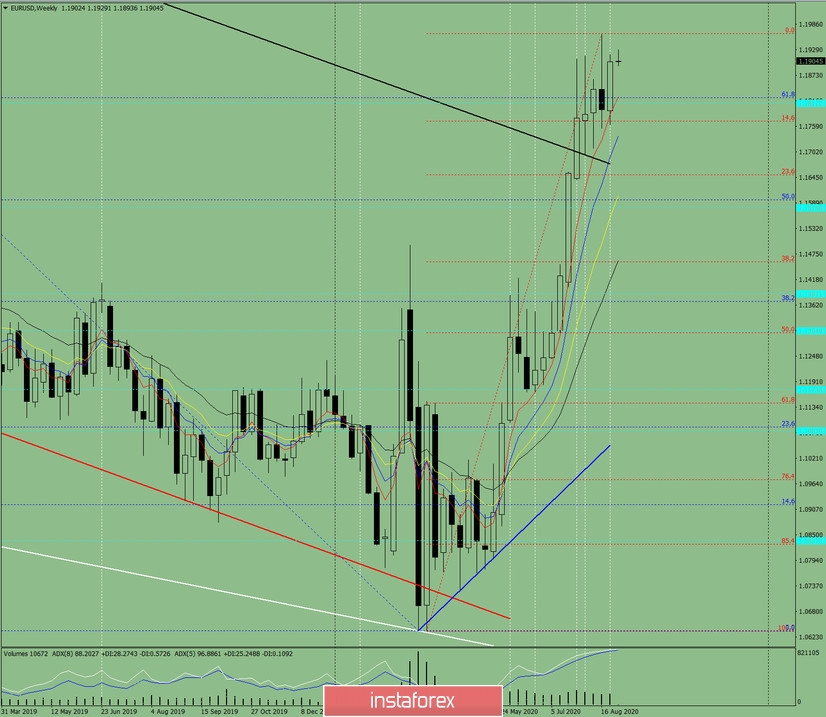
Figure: 1 (weekly chart).
Comprehensive analysis:
- indicator analysis - up;
- Fibonacci levels - up;
- volumes - up;
- candlestick analysis - down;
- trend analysis - up;
- Bollinger lines - up;
- monthly chart - up.
An upward movement can be concluded based on a comprehensive analysis.
The general result of the calculation of the candlestick of the EUR/USD currency pair according to the weekly chart: the price is likely to have an upward trend with the absence of a lower shadow in the weekly white candlestick (Monday - up) and the absence of a second upper shadow (Friday - up) this week.
The first upper target at 1.1965 is an upper fractal (red dotted line). Upon reaching this line, it is possible to continue working upwards with the target of 1.2101 - the pullback level of 76.4% (blue dotted line).
An unlikely scenario: when moving up and reaching the upper fractal 1.1965 (red dotted line), the price is unlikely to start working down, with the target at 1.1770 - the pullback level of 14.6% (red dotted line).
Díky analytickým přehledům společnosti InstaForex získáte plné povědomi o tržních trendech! Jako zákazníkovi společnosti InstaForex je Vám k dispozici velký počet bezplatných služeb umožňujících efektivní obchodování.

