 Zůstat
Obchodní podmínky
Nástroje


The pair traded downward on Friday and tested 1.3192 - a 23.6% pullback level (red dashed line). After this, the price rolled back up closing almost at the opening price of the daily candle. Today, the price may resume its downward movement. No news is expected from the economic calendar. A narrow market is expected due to the day off in the US.
Trend analysis (Fig. 1).
The market may continue to move downward from the level of 1.3279 (closing of Friday's daily candle) with the target of 1.3192 - a 23.6% pullback level (red dotted line). If this level is tested, the downward trend may continue with the next target of 1.3012 - a 38.2% pullback level (red dotted line).
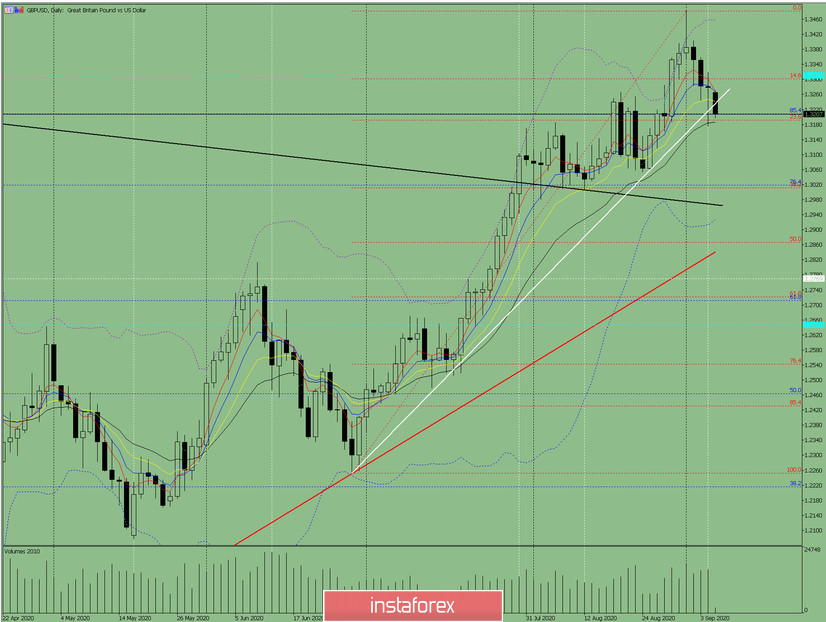
Figure: 1 (daily chart).
Comprehensive analysis:
- Indicator analysis - down;
- Fibonacci levels - down;
- Volumes - down;
- Candlestick analysis - up;
- Trend analysis - down;
- Bollinger lines - up;
- Weekly chart - down.
General conclusion:
Today, the price may continue to move downwards with the target of 1.3192 - a 23.6% pullback level (red dotted line). If this level is tested, the downward trend may continue with the next target of 1.3012 - a 38.2% pullback level (red dotted line).
Another possible scenario is from the level of 1.3279 (closing of Friday's daily candle), the price may move downward with the target of 1.3192 - a 23.6% pullback level (red dotted line). After testing this level, the price may begin to move upward with the target at the historical resistance level of 1.3310 (blue dotted line).
Díky analytickým přehledům společnosti InstaForex získáte plné povědomi o tržních trendech! Jako zákazníkovi společnosti InstaForex je Vám k dispozici velký počet bezplatných služeb umožňujících efektivní obchodování.

