 Zůstat
Obchodní podmínky
Nástroje


The pair traded downward on Monday and once again tested 1.1813 - a 23.6% pullback level (red dashed line). Today the price may continue to move down. No news is expected on the economic calendar.
Trend analysis (Fig. 1).
The market may continue to move downward from the level of 1.1816 (closing of yesterday's daily candle) with the target of 1.1753 located at the lower border of the Bollinger line indicator (blue dotted line). If this level is tested, the price may continue to move downward with the target of 1.1690 - a 38.2% pullback level (red dotted line).
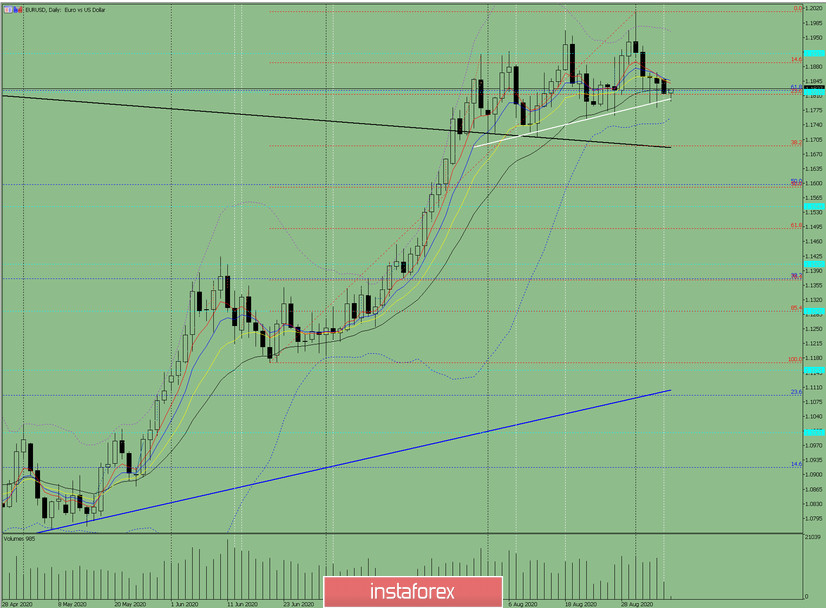
Figure: 1 (daily chart).
Comprehensive analysis:
- Indicator analysis - down;
- Fibonacci levels - down;
- Volumes - down;
- Candlestick analysis - up;
- Trend analysis - up;
- Bollinger lines - up;
- Weekly chart - down.
General conclusion:
Today, the price may continue to move downward from the level of 1.1816 (closing of yesterday's daily candle) with the target of 1.1753 located at the lower border of the Bollinger Band indicator (blue dotted line). If this level is tested, the price may continue to move downward with the target of 1.1690 - a 38.2% pullback level (red dotted line).
Another possible scenario is a downward trend with the target at the support level 1.1802 (white bold line). From here, the price may move upward with the target at the historical resistance level of 1.1912 (blue dashed line).
Díky analytickým přehledům společnosti InstaForex získáte plné povědomi o tržních trendech! Jako zákazníkovi společnosti InstaForex je Vám k dispozici velký počet bezplatných služeb umožňujících efektivní obchodování.

