 Zůstat
Obchodní podmínky
Nástroje


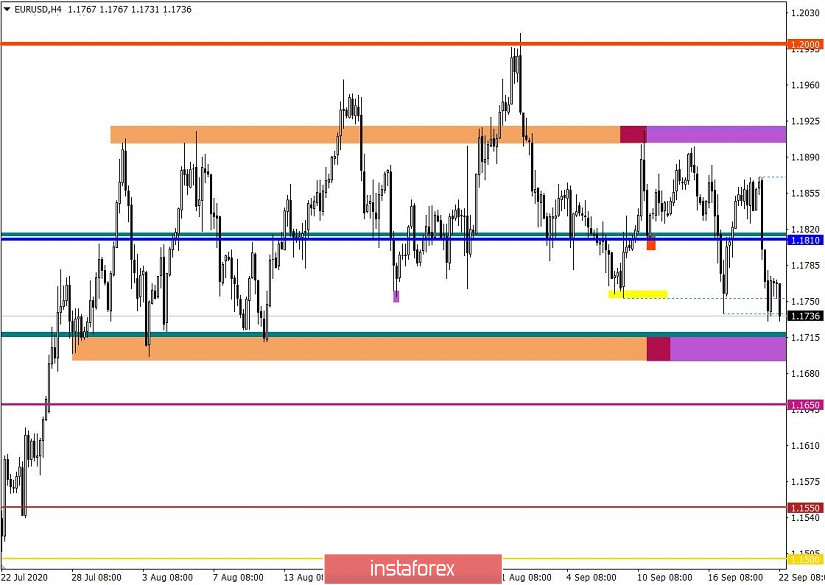
The euro/dollar pair managed to overcome the lower limit of accumulation of 1.1826/1.1871 during the speculative acceleration. As a result, there was an inertial move, which brought the quote to the area of interaction of trade forces at 1.1755. This is already the fifth touchdown of the 1.1755 area, where a slowdown regularly occurs. But we should not forget that the main support level is not the level of 1.1755, but 1.1700 level.
The sequence of moves indicates that the cycle of movement from 1.1910 to 1.1700 will end soon, and the side channel 1.1700 // 1.1810 // 1.1910 gets the next point where the lower border touches.
Now, the level of 1.1700 is worth paying attention to, as the subsequent course in the market will be clear depending on the fixing points, that is, we can get either a radical change in the market in the event of its breakdown, or a closed chain of the side channel.
Analyzing yesterday's fifteen-minute TF, you can see that a round of short positions, which arose from 7:15 and lasted until 14:30 UTC+00, just during this inertial course, the area of interaction of trading forces 1.1755 was affected. After that, there was a rebound followed by a slowdown in the control area.
In terms of daily dynamics, the highest indicator for 35 trading days is recorded. It amounted to 140 points, which is 70% higher than the average level. The slowdown in activity relative to last Friday (44 points) indicated a process of accumulation, this was the reason for the speculators who had accumulated the required trading volumes. The growth in activity is widespread, and panic in the market plays a significant role here.
As discussed in the previous review, traders considered a downward trend in case of a breakdown of the lower limit of accumulation of 1.1826/1.1871. Price consolidation below the level of 1.1810 confirmed their expectations. The forecast for the price movement to the value of 1.1755 coincided by 100%.

Considering the trading chart in general terms (daily period), we can see price fluctuations within the lower boundary of the variable flat 1.1700 // 1.1810 // 1.1910. The side channel has been in the market for more than seven weeks, where the mid-term upward trend may well be in doubt, if the level of 1.1700 is overcome.
Yesterday's news background did not have statistical data, but there was a planned speech by the head of the European Central Bank (ECB) Christine Lagarde, during which she said that the regulator is closely monitoring the strengthening of the euro.
Lagarde said that euro's strengthening clearly plays a role in various areas, and as for monetary policy, it puts downward pressure on the price level. She also said that they pay attention to the appreciation of the euro and consider it when determining our monetary policy.
The main lever of panic in the market was the information background dedicated to the second wave of coronavirus, where more and more countries confirm the increase in infections, and some countries are already preparing to tighten quarantine measures. All this puts a lot of pressure on the market in terms of emotional behavior, since everyone clearly remembers the March collapse and the consequences.
If the growth trend in cases of infection is maintained and new quarantine measures are introduced in the EU countries, everything can start again, in terms of weakening the European currency.
In terms of the economic calendar, data on home sales in the US secondary market is the only data expected today, which may grow by 0.9%. Speculators' main advantage will be the information background related to the coronavirus and quarantine measures, as well as the long-running Brexit.
Further development
By analyzing the current trading chart, it can be seen that sellers are holding on to the previously set course, which may lead to the price approaching the support level of 1.1700. The most important point will be the analysis of the behavior of market participants within the level of 1.1700, since the quote must consolidate below 1.1690 in the four-hour TF in order to change the structure of the side channel. Otherwise, a price rebound with a following movement within the boundaries of the seven-week flat 1.1700 // 1.1810 // 1.1910 can be expected.
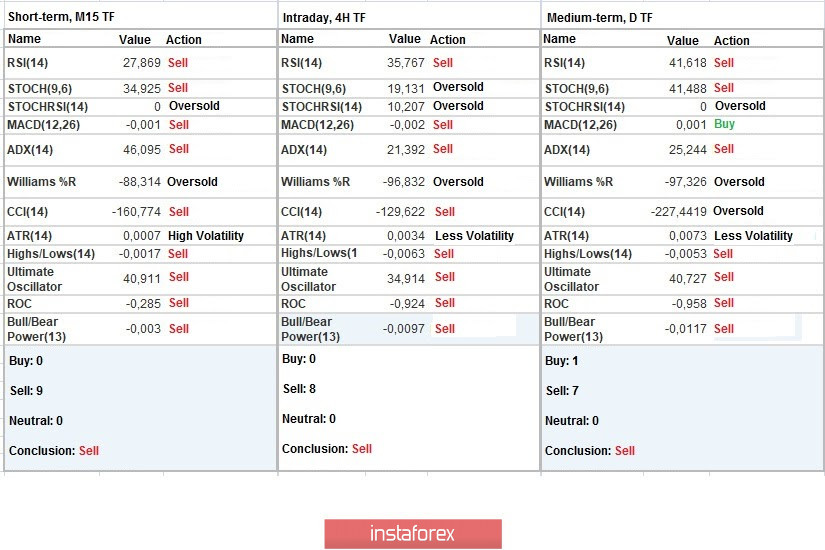
Indicator analysis
Analyzing different sectors of time frames (TF), we see that the indicators of technical instruments on the minute, hourly and daily intervals signal a sell due to the price convergence with the key level of 1.1700.
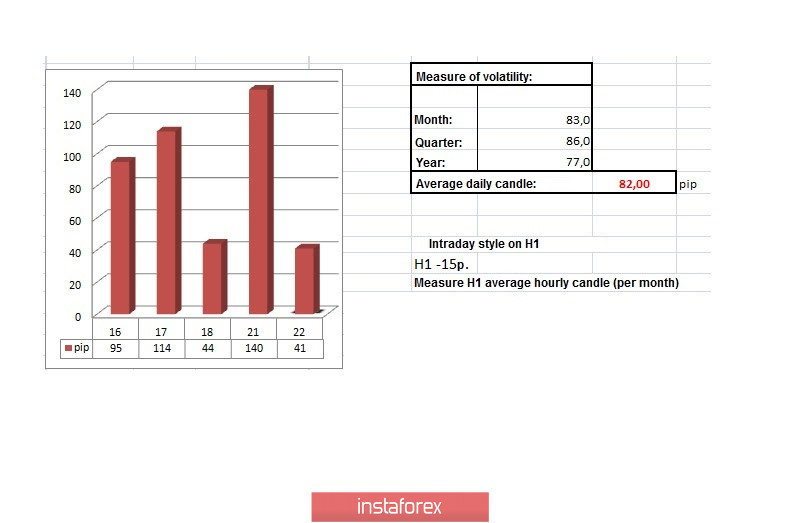
Weekly volatility / Volatility measurement: Month; Quarter; Year
The volatility measurement reflects the average daily fluctuations, calculated per Month / Quarter / Year.
(It was built considering the time of publication of the article)
The volatility of the current time is 41 points, which is 50% below the average. We can assume that if the level of 1.1700 breaks down, a flow of sales may occur, which will lead to a rise in volatility.
Key levels
Resistance zones: 1.1910 **; 1.2000 ***; 1.2100 *; 1.2450 **; 1.2550; 1.2825.
Support zones: 1.1700 1.1650 *; 1,1500; 1.1350; 1.1250 *; 1.1.180 **; 1.1080; 1.1000 ***.
* Periodic level
** Range level
*** Psychological level
Díky analytickým přehledům společnosti InstaForex získáte plné povědomi o tržních trendech! Jako zákazníkovi společnosti InstaForex je Vám k dispozici velký počet bezplatných služeb umožňujících efektivní obchodování.


