 Zůstat
Obchodní podmínky
Nástroje


What is needed to open long deals on GBP/USD
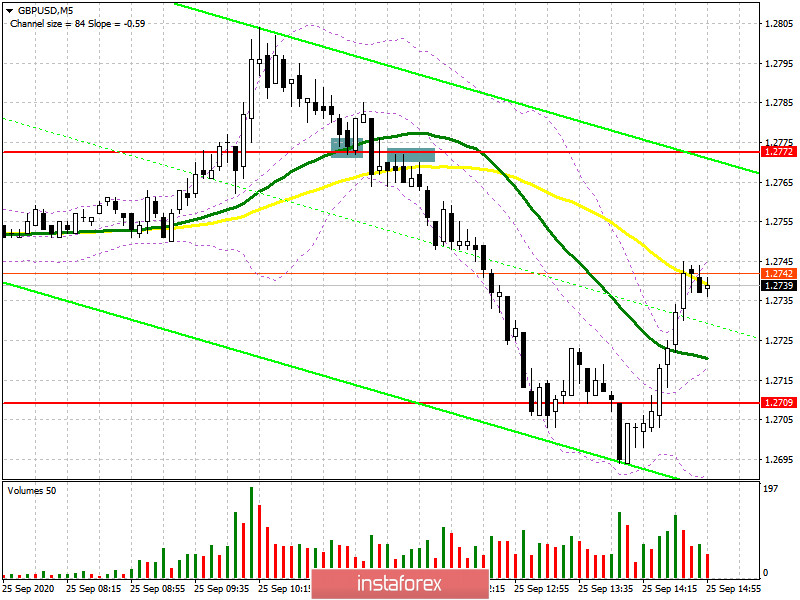
In the first half of the trading day, I paid attention to buying the sterling after the level of 1.2772 was breached and the price fixed above 1.2772. If you look at the 5-minute chart, you will see how the bulls are striving to push the price up above 1.2772. Then, the price declined. While this level was being tested from top downwards, the pair created a nice market entry point for long positions. Unfortunately, it happens that the market does not develop a further move. So the currency pair rapidly retreated to the level below 1.2772, thus creating an excellent entry point for short positions. Of course, it is risky to trade against the trend. However, it was the right decision to sell at a fake breakout. As a result, after the level of 1.2772 was tested, the pair fell to support of 1.2709.
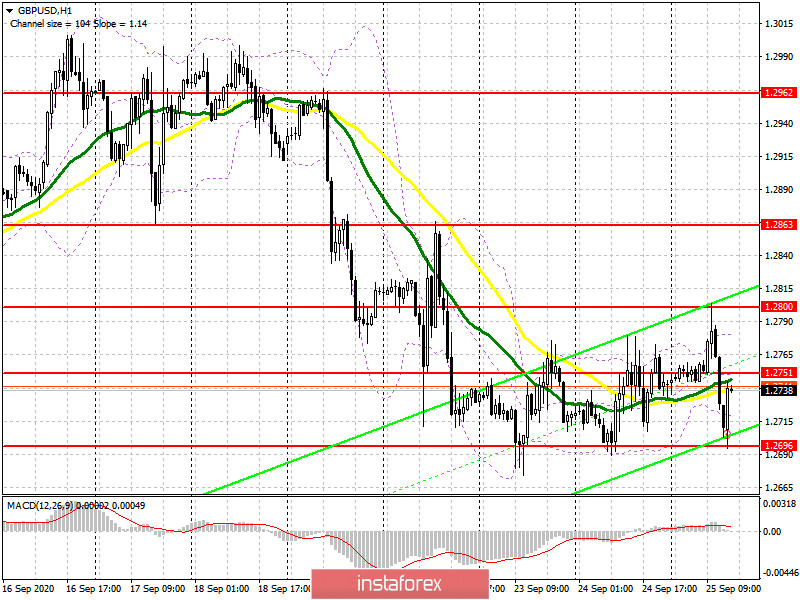
Now let's consider a one-hour chart. The technical picture has totally changed. Now we should trade bearing in mind new levels. The bulls should defend support of 1.2696 as the second test might create a good buy signal taking into account a breakout and the price fixation above the middle of the channel that is 1.2751. This will push GBP/USD up to the intraday high of 1.2800 where I recommend profit taking. Under the scenario of breaking the one-week low of 1.2696, it would be better to refrain from buying the sterling against the trend. So, we should wait for a test of a new area of 1.2645 and 1.2585 and open there long positions bearing in mind a 30-40 pips intraday correction.
What is needed to open short positions of GBP/USD
The first thing to do for the pound sellers is to focus on defending the middle of the trading range of 1.2751. The formation of a fake breakout here will be a new excellent entry point to open short positions with the view of a further bearish trend. The outlook for sellers will be confirmed by a breakout and fixation of the price below support of 1.2696. This will increase pressure on the pair and open the door for news local lows of 1.2645 and 1.2585 where I recommend profit taking. Under the scenario of the GBP/USD climb above the level of 1.2751in the second half of the trading day, it would better to wait for a higher border of the trading range of 1.2800. So, it will be a good time to sell the pound there bearing in mind a downward 30-40 pips intraday correction.
Signals of technical indicators
Moving averages
The pair is trading below 30- and 50-period moving averages. It indicates that the market is uncertain about a further trend.
Remark. The author is analyzing a period and prices of moving averages on the 1-hour chart. So, it differs from the common definition of classic daily moving averages on the daily chart.
Bollinger Bands
A breakout of the indicator's upper border of 1.2785 will trigger a new wave of the sterling growth. Alternatively, a breakout of the lower border of 1.2696 will increase pressure on the pair.
Definitions of technical indicators
Díky analytickým přehledům společnosti InstaForex získáte plné povědomi o tržních trendech! Jako zákazníkovi společnosti InstaForex je Vám k dispozici velký počet bezplatných služeb umožňujících efektivní obchodování.

