 Zůstat
Obchodní podmínky
Nástroje


EUR/USD 1H
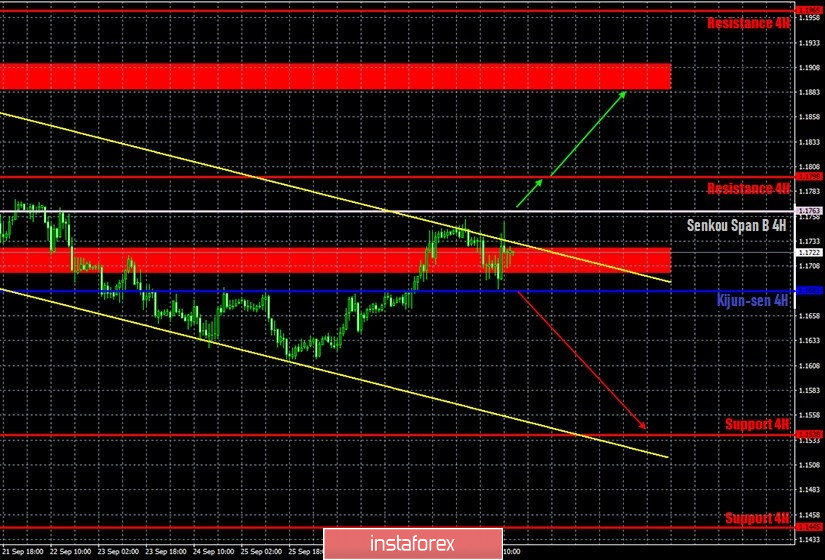
The euro/dollar pair perfectly reached the upper line of the descending channel, despite failing to overcome it the first time on the hourly timeframe on September 30. Therefore, it is likely that the pair might fall. Of course, buyers can make another attempt to overcome it. However, the downward trend remains as long as the price remains within the descending channel. Moreover, the bulls still need to overcome the equally strong Senkou Span B line in order to expect the upward movement to continue. If the pair settles below the critical line, then it may go back to moving downwards.
EUR/USD 15M
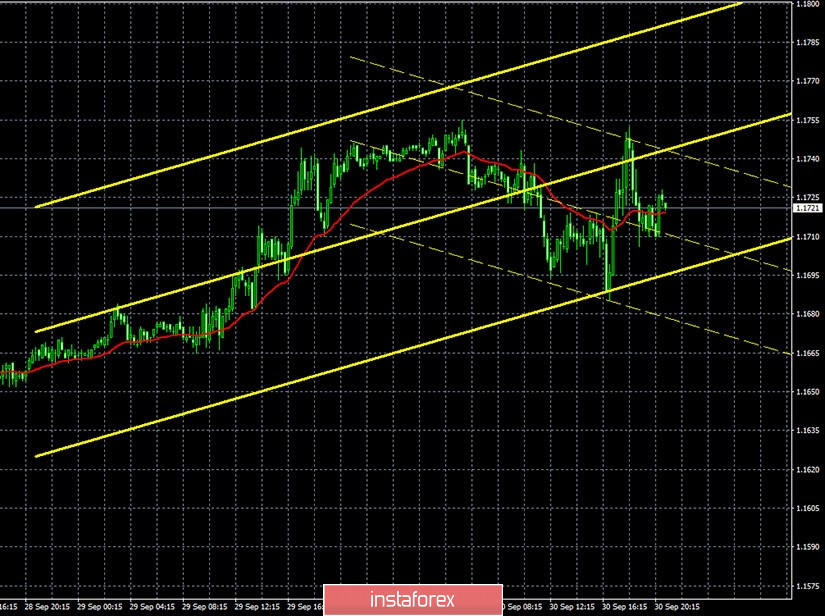
Both linear regression channels began to reverse to the downside on the 15-minute timeframe, as the price failed to overcome the descending channel on the hourly chart. The euro/dollar fell by about one and a half cents last reporting week (September 16-22). Recall that the previous Commitment of Traders (COT) report showed that the "non-commercial" group of traders, which we have repeatedly called the most important, sharply reduced their net positions. Thus, in general, the downward movement that began later on was sufficiently substantiated. The only problem is that it started late. The new COT report, which only covers the dates when the euro began its long-awaited fall, showed completely opposite data. Non-commercial traders opened 15,500 new Buy-contracts (longs) and almost 6,000 Sell-contracts (shorts) during the reporting week. Thus, the net position for this group of traders has increased by around 9,000, which shows that traders are becoming bullish. Accordingly, the behavior of the EUR/USD pair and the COT report data simply do not match. For the second week in a row. However, if you try to look at the overall picture, you can still take note of a very weak strengthening of the bearish sentiment, so the COT report allows a slight fall in the euro. The question is, will it continue to decline or is it already over? The pair even managed to rise by 40 points from September 23-29. Therefore, there are no such changes again.
Germany published the unemployment rate on Wednesday, which is only interesting because it helps to predict the pan-European unemployment rate. It turns out that unemployment actually decreased by the end of September, amounting to only 6.3%. This is not much for the crisis. Retail sales in Germany rose 3.1% month-on-month. Thus, the statistics for Europe were quite encouraging. The US data also turned out to be stronger than what market participants expected. The ADP's Private Sector Employment Change report showed more gains than traders had expected, and the third quarter GDP estimate showed an improvement to -31.4%. However, neither the one nor the other news caused a strong reaction from market participants. The European Union will publish the PMI for the manufacturing sector on Thursday, October 1. Similar figures will be released in Germany and the United States
We have two trading ideas for October 1:
1) Buyers continue to put pressure on the pair, but it is still not enough to break the current trend and for us to go beyond the descending channel. Therefore, we recommend opening long positions if the pair settles above the descending channel and the Senkou Span B line (1.1763) with targets at 1.1798 and the resistance area of 1.1886-1.1910, not earlier. Take Profit in this case will be from 20 to 110 points.
2) Bears keep it under control despite the fact that the euro has been growing for several days. As long as the price is within the channel, there are chances for the downward movement to resume. Below the Kijun-sen line, you are advised to resume trading bearish while aiming for the support level of 1.1538. In this case, the potential Take Profit is up to 110 points.
Explanations for illustrations:
Support and Resistance Levels are the levels that serve as targets when buying or selling the pair. You can place Take Profit near these levels.
Kijun-sen and Senkou Span B lines are lines of the Ichimoku indicator transferred to the hourly timeframe from the 4-hour one.
Support and resistance areas are areas from which the price has repeatedly rebounded off.
Yellow lines are trend lines, trend channels and any other technical patterns.
Díky analytickým přehledům společnosti InstaForex získáte plné povědomi o tržních trendech! Jako zákazníkovi společnosti InstaForex je Vám k dispozici velký počet bezplatných služeb umožňujících efektivní obchodování.


