 Zůstat
Obchodní podmínky
Nástroje


Trend analysis (Fig. 1)
Today, the market may start moving down from the level of 1.1860 (closing of Friday's daily candlestick) in order to reach the pullback level of 23.6% - 1.1817 (red dotted line). If this line is tested, there is a possibility that the downward movement will resume with the target of 1.1786-21 average EMA (black thin line).
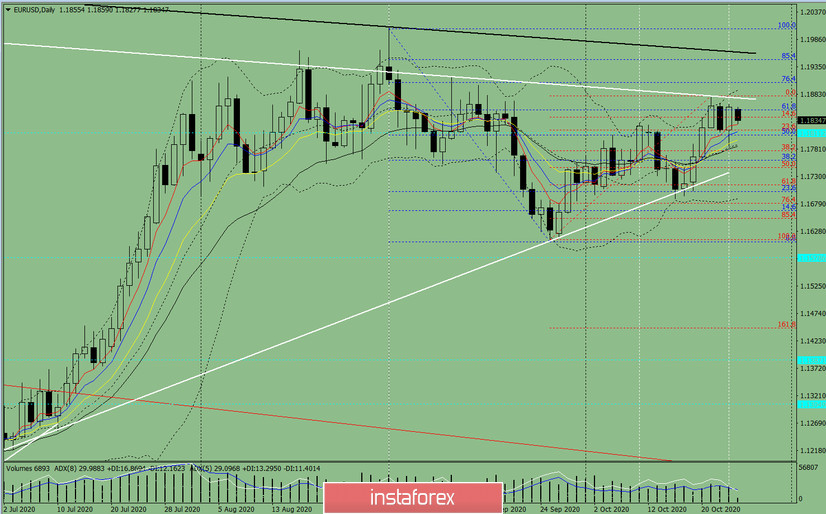
Figure 1 (daily chart).
Comprehensive analysis:
General conclusion:
Today, the price might make a downward movement in order to reach the pullback level of 23.6% - 1.1817 (red dotted line). If this line is tested, it is possible for the downward movement to continue with the target of 1.1786-21 average EMA (black thin line).
Unlikely scenario: from the level of 1.1860 (closing of the Friday day candle) - work down with the target of 1.1817, which is a pullback level of 23.6% (red dotted line). Upon testing this level, work up with the goal of 1.1880 upper fractal (red dotted line), from which the upper work is possible.
Díky analytickým přehledům společnosti InstaForex získáte plné povědomi o tržních trendech! Jako zákazníkovi společnosti InstaForex je Vám k dispozici velký počet bezplatných služeb umožňujících efektivní obchodování.

