 Zůstat
Obchodní podmínky
Nástroje


Trend analysis.
The price from the level of 1.1860 (closing of the last weekly candle) may pull back down this week, with the first goal at 1.1816 - a pullback level of 23.6% (red dashed line). After this level is tested, we can continue to work down with the goal of 1.1777 - the pullback level of 38.2% (red dotted line). Upon reaching this level, a further decline is likely.
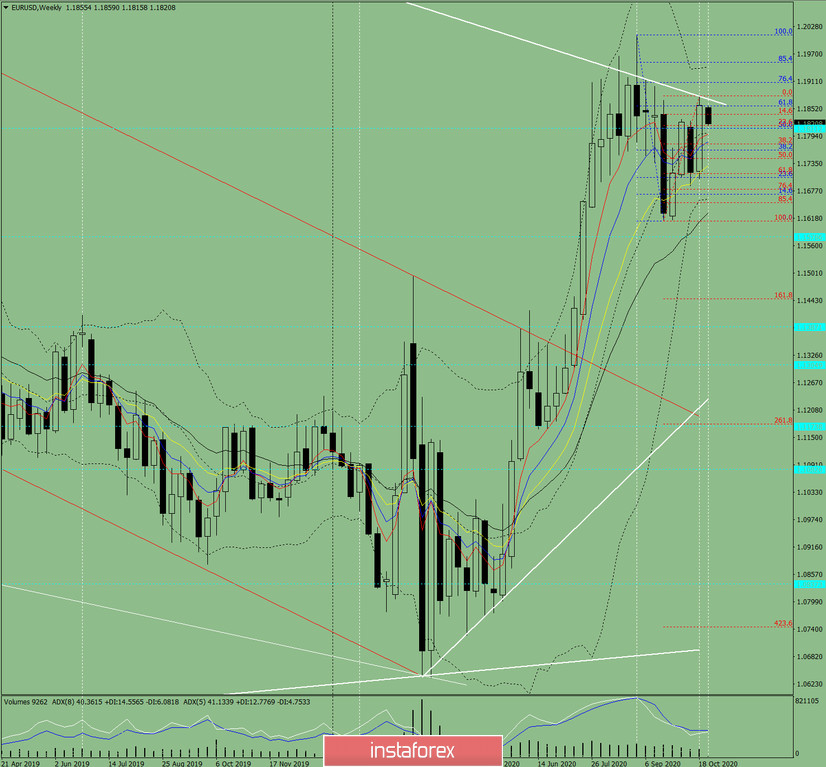
Figure: 1 (weekly chart).
Comprehensive analysis:
- indicator analysis - down;
- Fibonacci levels - down;
- volumes - down;
- candlestick analysis - down;
- trend analysis - down;
- Bollinger lines - up;
- monthly chart - up.
A decline can be concluded based on the comprehensive analysis.
The general result of calculating the candlestick of the EUR/USD pair on the weekly chart: the price is likely to decline this week without the upper shadow in the weekly black candlestick (Monday - down) and with the lower shadow (Friday - up).
The first downside goal is located at 1.1816 - a pullback level of 23.6% (red dashed line). After testing this level, we can continue to work downward with the goal of 1.1777 - the pullback level of 38.2% (red dotted line). Upon reaching this level, a further decline is likely.
An unlikely scenario: trading upwards with the goal of 1.1871 - resistance line (white thick line), while testing the level of 1.1860 (closing of the last weekly candle), with the goal of 1.1777 - a pullback level of 38.2% (red dotted line) is unlikely.
Díky analytickým přehledům společnosti InstaForex získáte plné povědomi o tržních trendech! Jako zákazníkovi společnosti InstaForex je Vám k dispozici velký počet bezplatných služeb umožňujících efektivní obchodování.

