 Zůstat
Obchodní podmínky
Nástroje


Trend analysis (Fig. 1).
Today, the market from the level of 1.1776 (the closing of yesterday's daily candle) can start moving up with the goal of 1.1814 which is a pullback level of 76.4% (blue dotted line). When testing this level, further work up with the goal of 1.1858 which is the resistance line (white bold line).
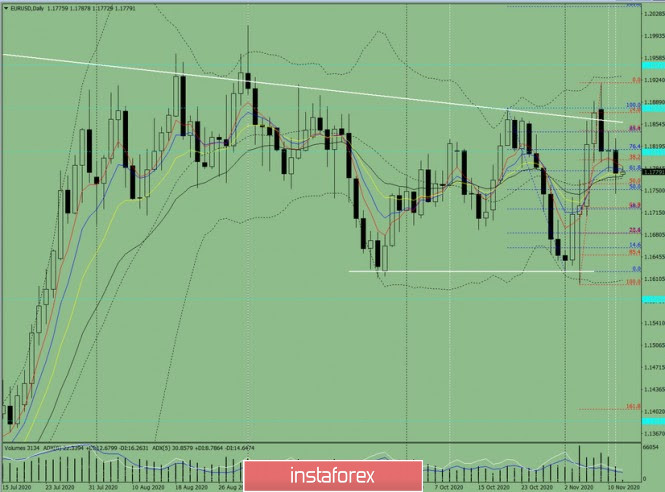
Figure 1 (daily chart).
Complex analysis:
General conclusion:
Today, the market from the level of 1.1776 (the closing of yesterday's daily candle) can start moving up with the goal of 1.1814 which is a pullback level of 76.4% (blue dotted line). When testing this level, further work up with the goal of 1.1858 which is the resistance line (white bold line).
Alternative scenario: From the level of 1.1781, which is a pullback level of 61.8% (blue dotted line), the price can continue to move down with the goal of 1.1761 which is a pullback level of 50.0% (red dotted line). When testing this level, further work down with the goal of 1.1723 which is a rollback level of 61.8% (red dotted line).
Díky analytickým přehledům společnosti InstaForex získáte plné povědomi o tržních trendech! Jako zákazníkovi společnosti InstaForex je Vám k dispozici velký počet bezplatných služeb umožňujících efektivní obchodování.


