 Zůstat
Obchodní podmínky
Nástroje


Trend analysis
The price from the level of 1.2181 (closing of the last weekly candle) may start rising to the pullback level of 85.4% - 1. 2272 (blue dotted line) this week. Upon reaching this level, the upward movement will continue to the next target of 1.2462 (blue dotted line) – the historical resistance level.
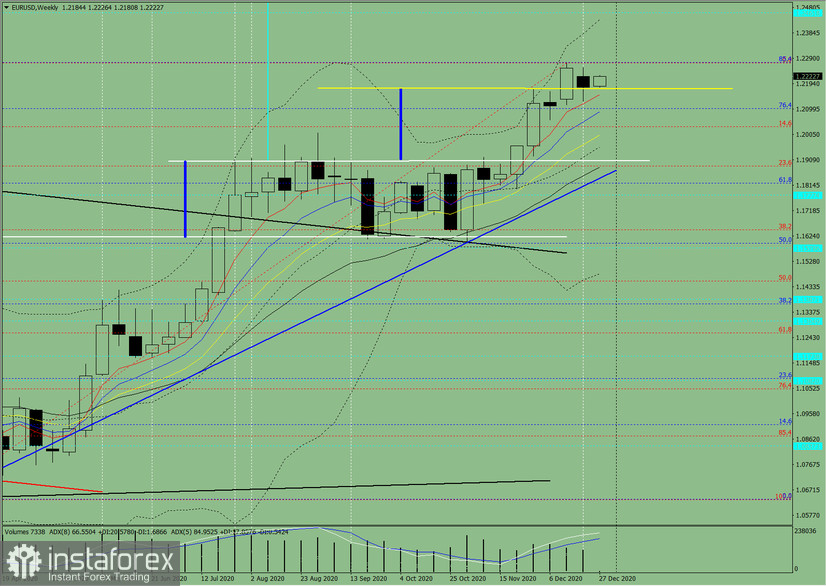
Figure 1 (weekly chart)
Comprehensive analysis:
An upward movement can be concluded based on comprehensive analysis.
The overall result of the candlestick calculation on the weekly chart: the price is likely to have an upward trend this week, without a lower shadow in the weekly white candlestick (Monday - up) and no upper shadow (Thursday - up).
The first upper target is 1.2272 – a pullback level of 85.4% (blue dotted line). Upon reaching this level, the upward movement is expected to continue to the target of 1.2462 (blue dotted line) – the historical resistance level.
An alternative scenario: the price from the level of 1.2181 (closing of the last weekly candle) will move upwards to the target of 1.2272 – a pullback level of 85.4% (blue dotted line). After reaching this level, it can decline to the target of 1.2033 – a pullback level of 14.6% (red dotted line).
Díky analytickým přehledům společnosti InstaForex získáte plné povědomi o tržních trendech! Jako zákazníkovi společnosti InstaForex je Vám k dispozici velký počet bezplatných služeb umožňujících efektivní obchodování.

