 Zůstat
Obchodní podmínky
Nástroje


Here are the details of the economic calendar for October 1:
Last Friday, preliminary data on Europe's inflation were published, where there was growth from 3.0% to 3.4%. In fact, we got ahead of all possible expectations regarding the growth rate of consumer prices. Such statistics jeopardize the monetary policy of the European Central Bank once again.
Analysis of trading charts from October 1:
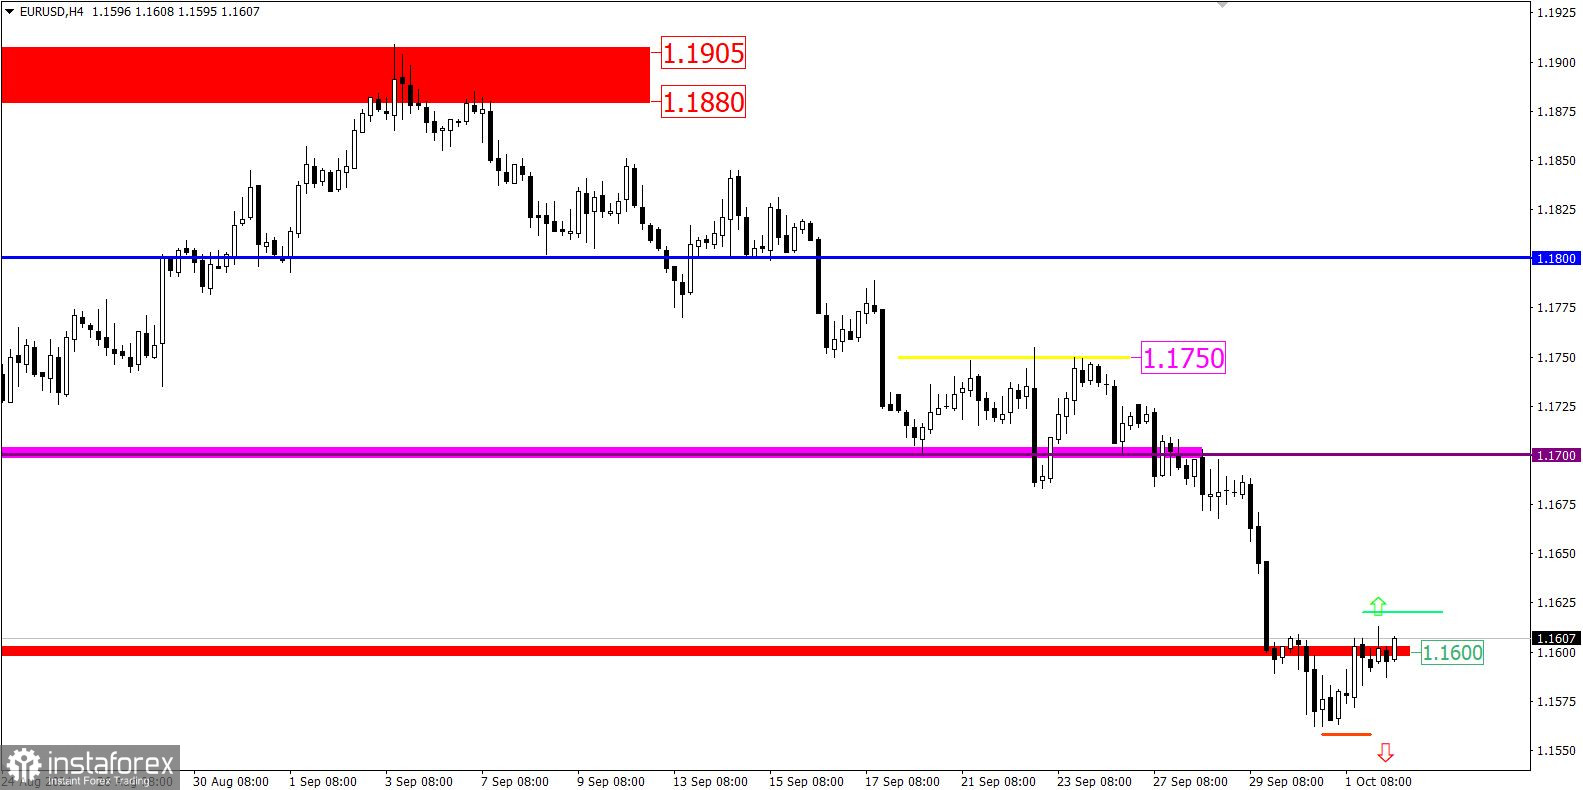
The EUR/USD currency pair reached the level of 1.1562 during a sharp decline, where a reduction in the volume of short positions occurred. This led to a slowdown and a technical pullback towards the previously broken level of 1.1600.
Despite the euro's oversold status, the downward trend is still relevant among market participants. This is indicated by a number of facts: the prolongation of the downward cycle from the beginning of June, and the price holding at the levels of July 2020.
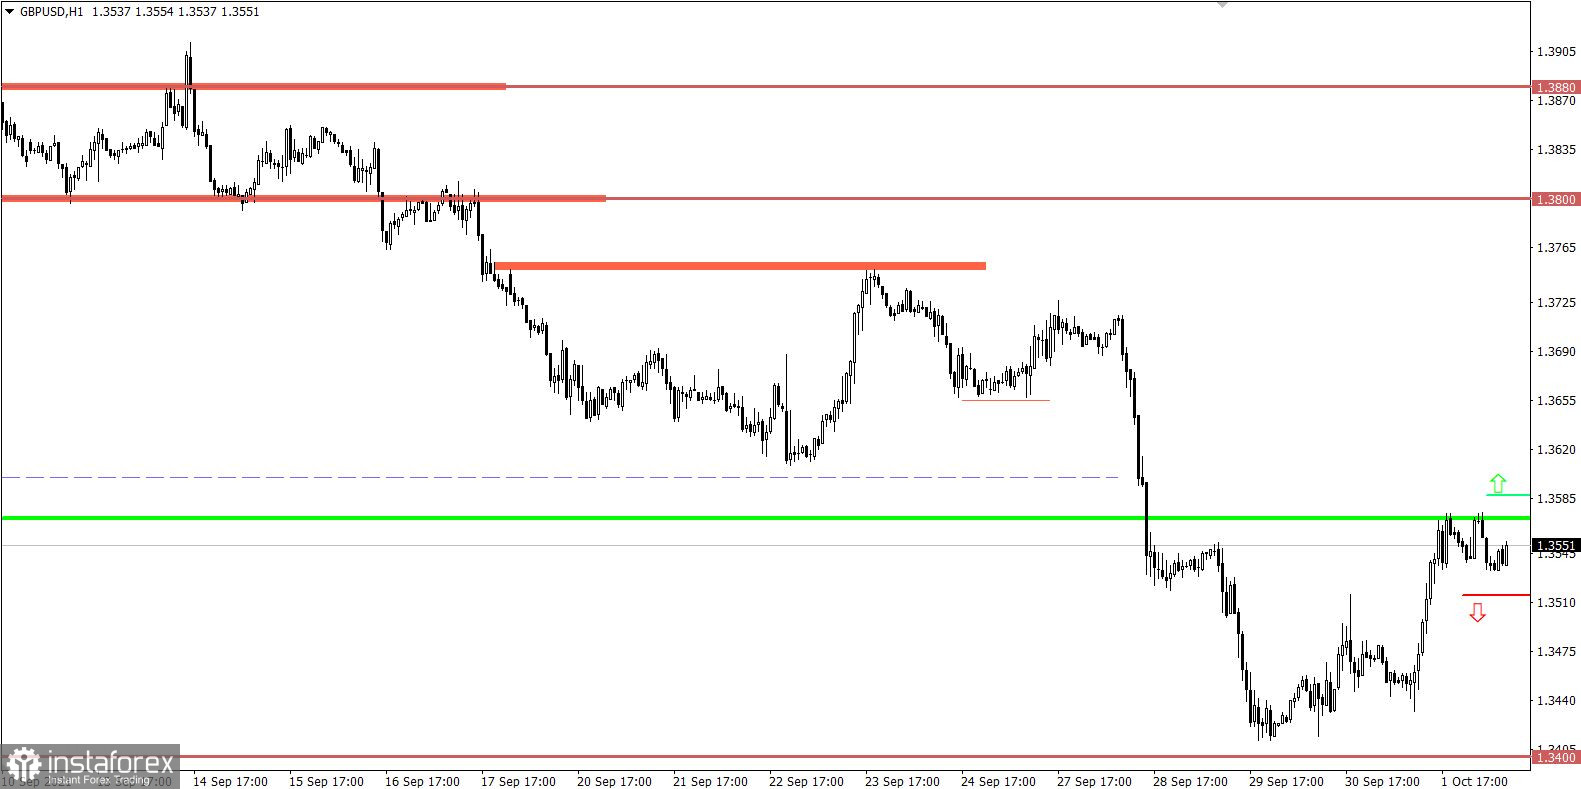
Last week, the GBP/USD pair showed a truly strong downward interest, as a result of which the quote fell to the support area of 1.3400. The high level of oversold of the pound caused a technical correction in the market, which led to a partial recovery in the volume of long positions.
* Oversold market – a situation where prices have dropped too low and quickly. In this case, we are talking about the euro and the pound, which have lost almost 150 and 300 points from the value.
Short positions or Short means sell positions. Long positions or Long means positions to buy in anticipation of an increase in the value of the asset.
October 4 economic calendar:
The volume of US industrial orders for August will be published today at 14:00 Universal time, where the growth of 1% is expected.
This indicator reflects the total number of orders for durable and non-durable goods in the manufacturing sector. This allows us to assess the level of activity in this area, which is an important indicator of the state of the economy. A high result strengthens the US dollar.
Trading plan for EUR/USD on October 4:
In this situation, the oversold status may well change from a pullback to a correction. This signal will be confirmed if the price stays above the level of 1.1620. Meanwhile, the 1.1700 mark is considered as the resistance level towards correction.
A signal to prolong the downward cycle will be the price holding below the level of 1.1550. This step will open the way towards 1.1420.
Trading plan for GBP/USD on October 4:
The level of 1.3570 stands as a resistance towards the correction, relative to which there was a stop. A signal to sell will be the price holding below the level of 1.3515. This will lead to the restoration of the volume of short positions and, as a result, the continuation of the downward course.
A signal to prolong the corrective move will be the price holding above the level of 1.3885, which will give the pound an opportunity to strengthen its value a little more.
* The resistance level is the so-called price coordinate, from which the quote can slow down or stop the upward course. The principle of constructing this level is to reduce the price stop points on the history of the chart, where a price reversal in the market has already taken place.
What is reflected in the trading charts?
A candlestick chart view is graphical rectangles of white and black light, with sticks on top and bottom. When analyzing each candle in detail, you will see its characteristics of a relative period: the opening price, closing price, and maximum and minimum prices.
Horizontal levels are price coordinates, relative to which a stop or a price reversal may occur. These levels are called support and resistance in the market.
Circles and rectangles are highlighted examples where the price of the story unfolded. This color selection indicates horizontal lines that may put pressure on the quote in the future.
The up/down arrows are the reference points of the possible price direction in the future.
Golden Rule: It is necessary to figure out what you are dealing with before starting to trade with real money. Learning to trade is so important for a novice trader because the market is constantly dynamic and it is important to understand what is happening.
Díky analytickým přehledům společnosti InstaForex získáte plné povědomi o tržních trendech! Jako zákazníkovi společnosti InstaForex je Vám k dispozici velký počet bezplatných služeb umožňujících efektivní obchodování.

