 Zůstat
Obchodní podmínky
Nástroje


Here are the details of the economic calendar for October 7:
The United States released its applications for unemployment benefits data yesterday, where there was a decline in the volume.
Details of statistics:
The volume of initial applications for benefits fell from 364,000 to 326,000.
The volume of repeated applications for benefits fell from 2,811 to 2,714 thousand.
* Applications for unemployment benefits reflect the number of currently unemployed citizens and those receiving unemployment benefits. This indicator is considered to be the state of the labor market, where the growth of the indicator negatively affects the level of consumption and economic growth. The reduction of applications for benefits has a positive effect on the labor market.
Analysis of trading charts from October 7:
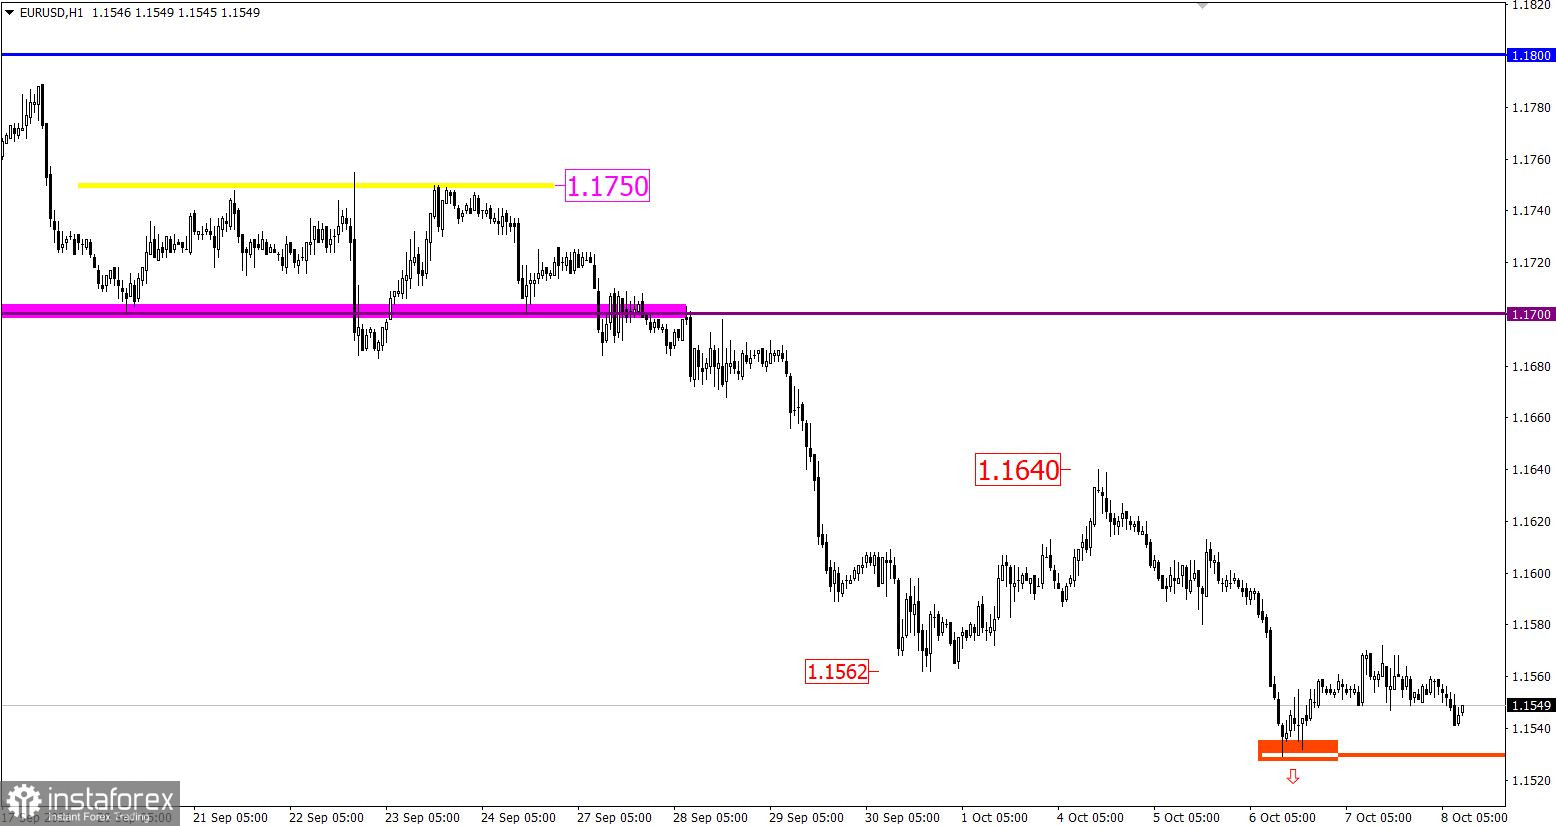
The EUR/USD pair slightly slowed down the downward movement, where the level of 1.1529 is used as a pivot point. A pullback followed by stagnation only signals that the downward interest is relevant in the market. Otherwise, we would see a technical correction due to the rapidly oversold euro rate.
The trading plan on October 7 allowed for the formation of a small pullback, but the main pivot point is a decline.
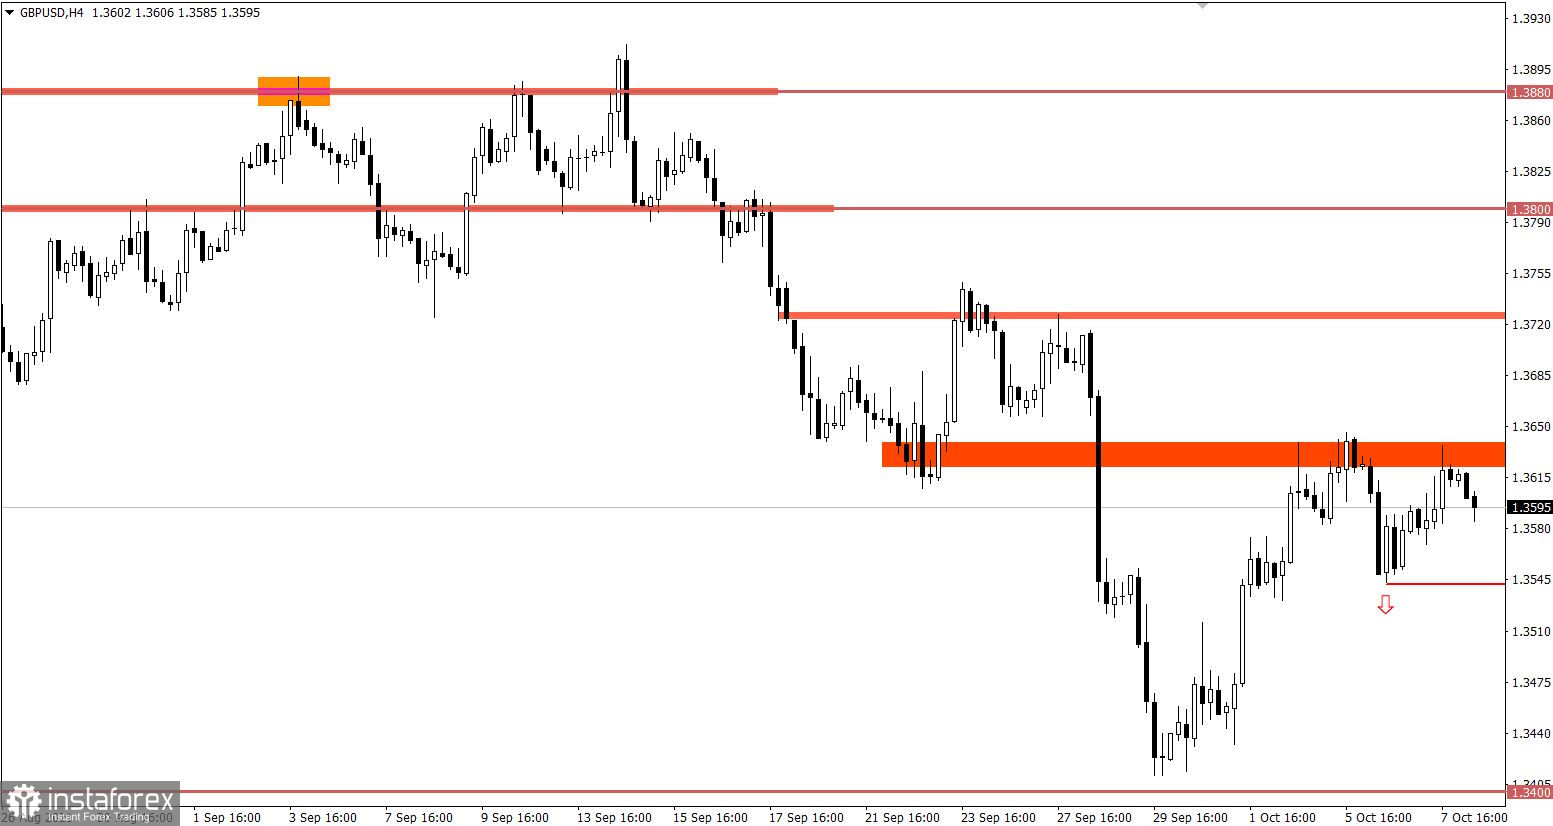
The GBP/USD pair is still considering the area of 1.3620/1.3650 as resistance, which does not allow the current correction to prolong the course. Based on the downward cycle from the beginning of June, sellers still have high chances to continue their movement.

October 8 economic calendar:
In terms of the economic calendar, a report by the United States Department of Labor will be published today, which is considered one of the most important economic events in the finance world.
The unemployment rate in June may fall from 5.2% to 5.1%.
Outside agriculture, 488 thousand new jobs can be created against 235 thousand in the previous reporting period.
From the statistics, it can be seen that experts predict a further recovery process, which may result in an increase in the US dollar if expectations coincide.
Trading plan for EUR/USD on October 8:
The euro's decline by more than 3% since the beginning of autumn does not frighten sellers. The subsequent growth in the volume of short positions is expected if the price is kept below the level of 1.1520. This will lead to a strengthening of the decline towards the level of 1.1420.
Trading plan for GBP/USD on October 8:
The resistance area of 1.3620/1.3650 will continue to put pressure on long positions. This may lead to a decline towards the local low on October 6. The main sell signal of the pound sterling will appear if the price is kept below the level of 1.3530. In the future, we may see a decline towards the support level of 1.3400.
What is reflected in the trading charts?
A candlestick chart view is graphical rectangles of white and black light, with sticks on top and bottom. When analyzing each candle in detail, you will see its characteristics of a relative period: the opening price, closing price, and maximum and minimum prices.
Horizontal levels are price coordinates, relative to which a stop or a price reversal may occur. These levels are called support and resistance in the market.
Circles and rectangles are highlighted examples where the price of the story unfolded. This color selection indicates horizontal lines that may put pressure on the quote in the future.
The up/down arrows are the reference points of the possible price direction in the future.
Díky analytickým přehledům společnosti InstaForex získáte plné povědomi o tržních trendech! Jako zákazníkovi společnosti InstaForex je Vám k dispozici velký počet bezplatných služeb umožňujících efektivní obchodování.


