 Zůstat
Obchodní podmínky
Nástroje


EUR/USD 24-hour TF analysis.
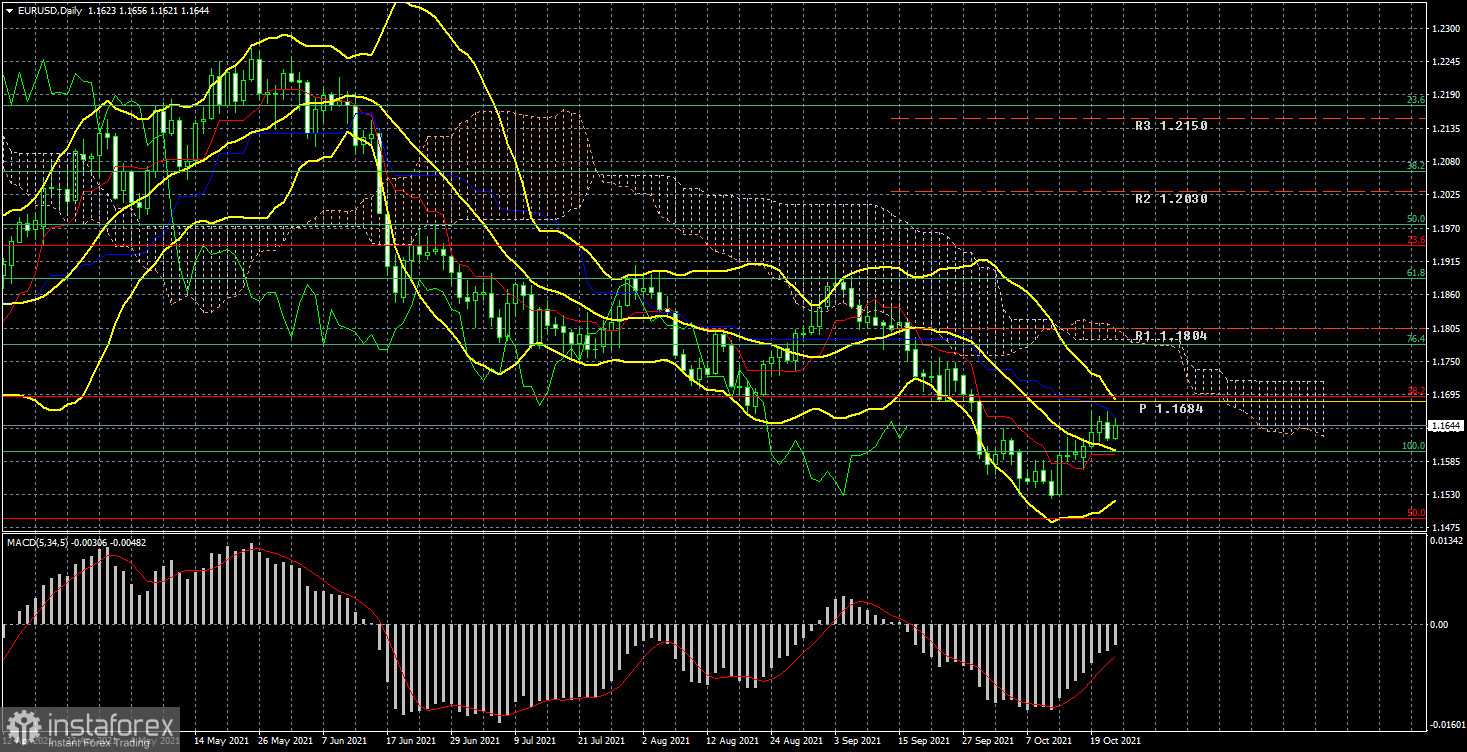
The EUR/USD currency pair continued to adjust against the short-term downward trend during the current week as a whole. However, we remind you that the movement seen in the illustration above is only a correction against a much more powerful upward trend that has been forming in the last year and a half. The illustration above also clearly shows that the quotes could not reach the Fibonacci level of 50.0% and slightly adjusted upwards, having worked out the critical line. Thus, at this time, the downward trend is completely preserved. We would also like to note that the downward movement may well continue. Recall that the exchange rate of any currency depends not on the "foundation," "macroeconomics," or "technology," but on the actions of market participants.
Moreover, they also include central banks, which are the largest participants and can directly influence monetary policy and the volume of the money supply. And the volume of money supply cannot but be reflected in the exchange rate of a particular currency. Therefore, we still believe that the fall of the US currency would be more logical at this time. However, major market participants do not report on their actions and may have their strategy for operations in the foreign exchange market. For example, non-commercial. Therefore, at the moment, there are no signals to buy. Moreover, a rebound from the critical Kijun-sen line will already be a sell signal and a signal to continue moving south.
Analysis of the COT report.
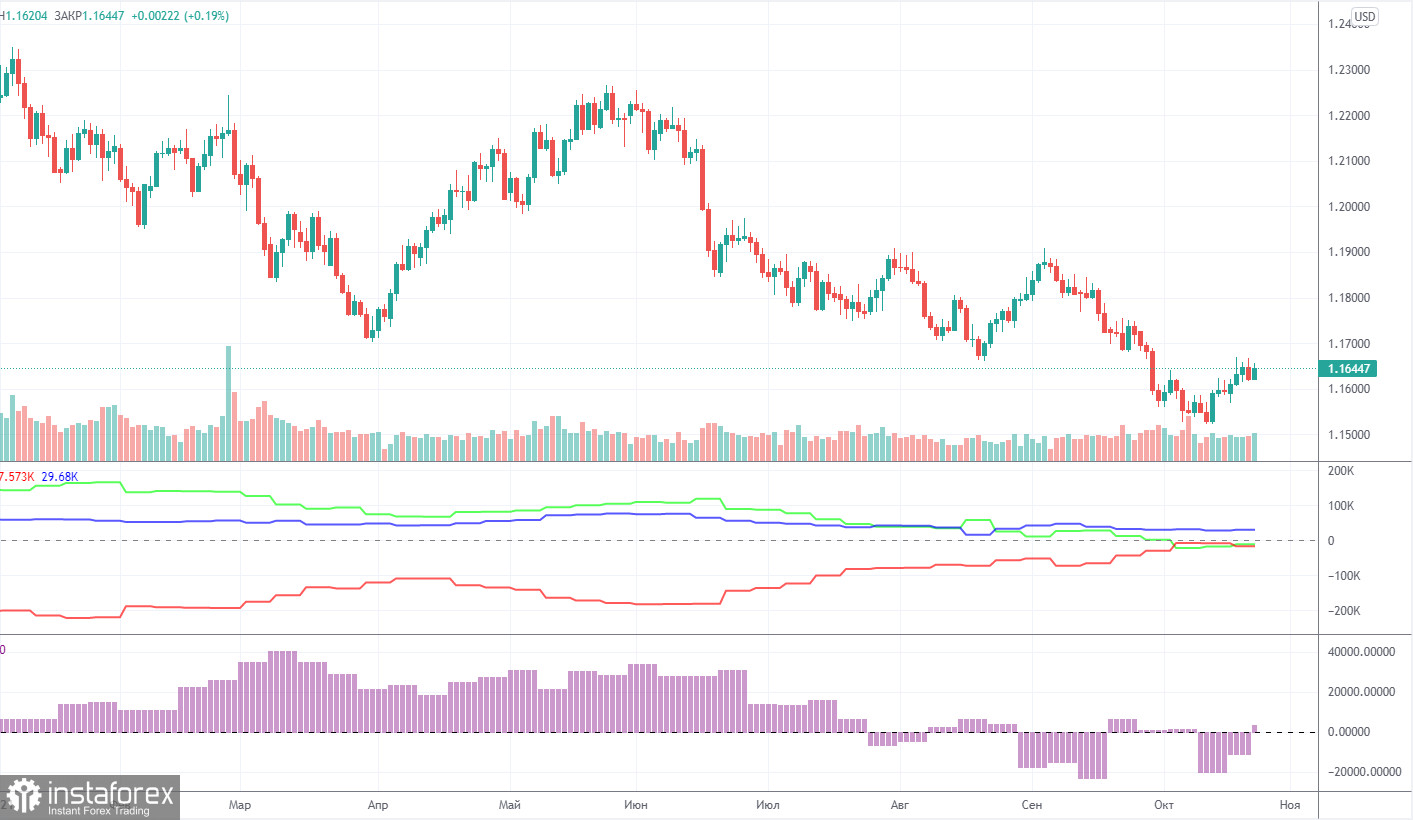
During the last reporting week (October 18-22), the mood of non-commercial traders changed in a bullish direction. During the reporting week, 8.5 thousand contracts for purchase and 16 thousand contracts for sale were closed. Thus, the net position of the Non-Profit Traders group, which is the most important group, increased by 7.5 thousand. And here it's time to talk about the "disease of the British pound." Recall that the net position of professional players in the pound has been jumping up and down in the last few months. And this suggests that there is no single mood and there is no clear trend. We are seeing the same thing now for the euro currency. It is eloquently signaled by the second indicator, which shows an increase in the net position, then its decrease.
Consequently, at this time, the major players do not understand what they should do next with the euro. Also, the illustration above shows that the pair's rate has gone only 100 points below the previous local minimum. Therefore, at this time, the whole technical picture of the long-term plan still looks like a standard three-wave correction. Thus, from our point of view, the formation of a new upward trend in the near future is still very likely, given the attempts with which the European currency has been falling in the last 8-9 months. But at the same time, we remind you that while there are no buy signals, you should not rush into the market with purchases. Any fundamental hypothesis requires specific technical confirmations. If there are none, then you should not make appropriate trading decisions.
Analysis of fundamental events.
There were few macroeconomic and fundamental events this week. There were practically none at all. We can only highlight the report on industrial production in the United States, which unexpectedly for many declined by 1.3% in September, and the report on European inflation, which remained unchanged at 3.4% in September. Also, on Friday, business activity indices in the United States and the European Union were published. However, there were no major changes here either. Business activity in the manufacturing sector of the EU decreased slightly, in the service sector - decreased slightly. Business activity in the US manufacturing sector declined slightly, while for the services sector it increased slightly. It is not surprising, given that the "coronavirus" epidemic is not receding either in the European Union or in the States. Thus, there was no reaction to all of the above macroeconomic events. The pair continued to move with the low volatility in recent months and shows its complete disinterest in more active movements.
Trading plan for the week of October 25 - 29:
1) On the 24-hour timeframe, the upward trend has not changed since bulls can still overcome the important lines of the Ichimoku indicator. The pair is being adjusted, and its further movement will depend on overcoming or overcoming the Kijun-sen line. Thus, new sales of the European currency will be possible if the price bounces off the critical line. The nearest target is a strong and important 50.0% Fibonacci level of 1.1490.
2) As for purchases of the euro/dollar pair, they should be considered no earlier than fixing the price above the critical line in the current conditions. And ideally, above the Ichimoku cloud, because the price has already overcome Kijun-sen several times, but then "stumbled" about Senkou Span B. There are few prerequisites for a new upward trend to begin in the near future, although the general fundamental background still indicates a very likely fall in the dollar.
Explanations to the illustrations:
Price levels of support and resistance (resistance /support), Fibonacci levels - target levels when opening purchases or sales. Take Profit levels can be placed near them.
Ichimoku indicators(standard settings), Bollinger Bands(standard settings), MACD(5, 34, 5).
Indicator 1 on the COT charts - the net position size of each category of traders.
Indicator 2 on the COT charts - the net position size for the "Non-commercial" group.
Díky analytickým přehledům společnosti InstaForex získáte plné povědomi o tržních trendech! Jako zákazníkovi společnosti InstaForex je Vám k dispozici velký počet bezplatných služeb umožňujících efektivní obchodování.

