 Zůstat
Obchodní podmínky
Nástroje


GBP/USD 5M
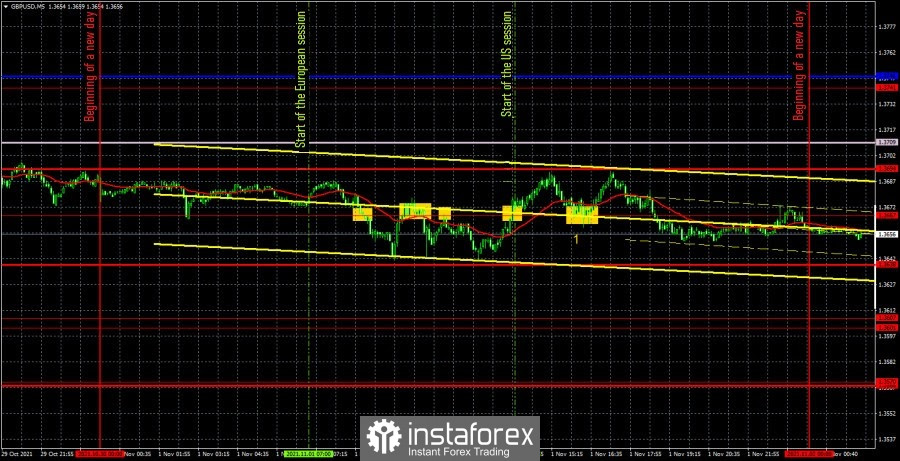
The GBP/USD pair was traded "for show" on November 1. Simply put, the pound/dollar has returned to its usual pattern of movement and the usual volatility. During the day, about 50 points were passed from the low to the high, which is about the same as the euro/dollar pair, traditionally a much less volatile pair, passed. However, the pound has really been surprising with its activity lately. Recall that GBP/USD in total passed less than EUR/USD on Thursday and Friday. In general, it was extremely inconvenient to trade the pound/dollar pair on Monday. Unfortunately, not only the volatility was low, but the very nature of the movement was as similar as possible to the flat. The price was between the levels of 1.3638 and 1.3694 all day and crossed or reached the extreme level of 1.3667 as many as five times. That is, five trading signals were formed in the flat. But there were practically no macroeconomic statistics during the day. The report on the ISM index in America, which we have already mentioned, also had no effect on the movement of the pound/dollar pair, and after its release, the US currency began to become cheaper, and not more expensive, which would be more logical. Thus, we can only consider all the trading signals and understand how we should have traded on Monday. The first sell signal was formed in the European session, when the price settled below the level of 1.3667. After its formation, the pair went down only 13 points and returned to the level of 1.3667, bounced off it, returned again and bounced again. Thus, as many as three sell signals were generated in a short period of time. And traders should have just stayed in short positions. However, at the beginning of the US session, this level was still overcome, so the short position closed at a loss of 19 points. According to the same signal about overcoming the level of 1.3667, it was necessary to open long positions, but it was also not possible to develop an upward movement. The price once returned to the level of 1.3667 and bounced off it from above, which made it possible to remain in long positions. As a result, the deal had to be closed in the maximum available profit, because by the evening it became clear for sure that no strong movement would happen. As a result, points 8-9 could be won back.
GBP/USD 1H
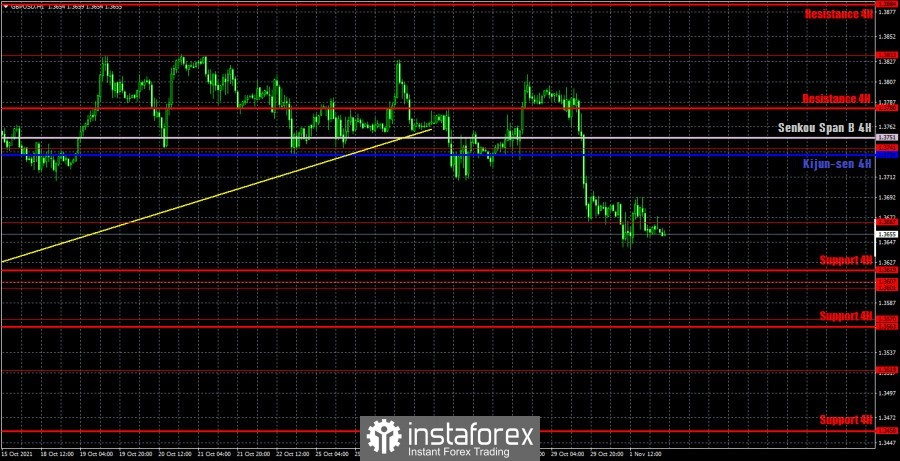
The pound/dollar pair is still trying with all its might to form a downward trend on the hourly timeframe, but so far little has come of it. It is still impossible to form a descending trend line, or it will be almost horizontal, which makes no sense. Thus, so far, trading on this timeframe is complicated, and the technical picture looks very ambiguous. We highlight the following important levels on November 2: 1,3601 – 1,3607, 1,3667, 1,3741, 1,3833. The Senkou Span B (1.3751) and Kijun-sen (1.3734) lines can also be signal sources. It is recommended to set the Stop Loss level to breakeven when the price passes in the right direction by 20 points. The lines of the Ichimoku indicator can move during the day, which should be taken into account when searching for trading signals. No important reports will be published in the UK on Tuesday, as well as in the US. Also, no important fundamental events are planned for this day. However, on Wednesday, the results of the Federal Reserve meeting will be summed up in America, and on Thursday – the Bank of England. Thus, traders only need to wait a little.
We recommend you to familiarize yourself:
Overview of the EUR/USD pair. November 2. A surprise may await us on Wednesday. Not from the Fed, but from the markets themselves.
Overview of the GBP/USD pair. November 2. A new conflict erupts between Britain and France.
Forecast and trading signals for GBP/USD for November 2. Detailed analysis of the movement of the pair and trade deals.
COT report
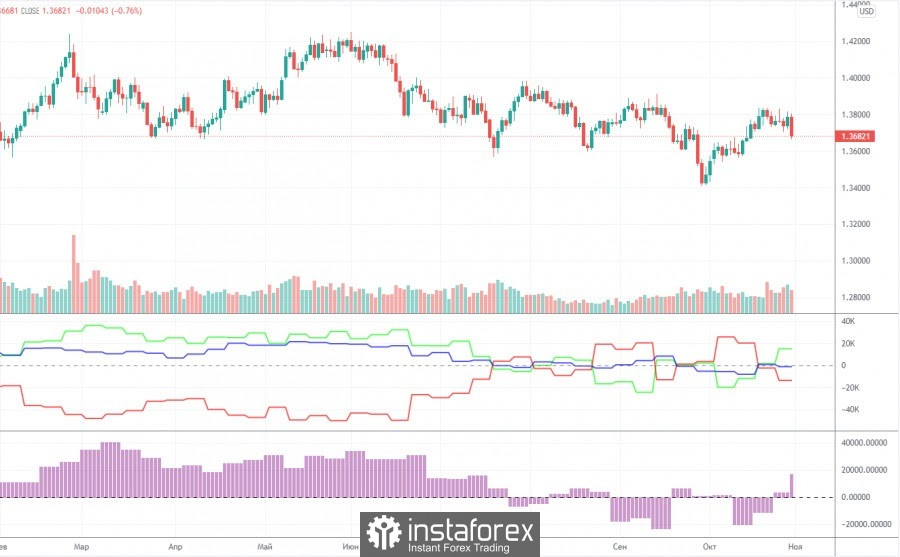
The mood of professional traders became more bullish during the last reporting week (October 19-25). The situation with the COT reports is now even more ambiguous than with the technical picture. And if we compare the COT reports for the euro and the pound, the situation becomes even stranger. Both indicators in the chart above show that the major players still do not have any clear, precise and understandable mood. Consequently, it simply does not make sense to make any forecasts based on COT reports now. The chart above clearly shows the pair's entire movement over the past six months. It is rather difficult to call it a trend or even a trend. The mood of the big players has been constantly changing in the last couple of months. The green and red lines of the first indicator (net positions of groups of traders "commercial" and "non-commercial") are constantly changing the direction of movement, constantly crossing the zero mark. This means that the two largest groups of traders are constantly increasing and decreasing their net positions. During the reporting week, professional traders opened 2.8 thousand buy contracts (longs) and closed 10.7 thousand sell contracts (shorts). Thus, their net position increased by 10,000 contracts. This is in line with what has been happening with the pound in recent weeks (it is growing). Nevertheless, it is impossible to make a long-term forecast, since the net position may fall already by the end of next week. Especially considering the fall of the pound itself on Friday.
Explanations for the chart:
Support and Resistance Levels are the levels that serve as targets when buying or selling the pair. You can place Take Profit near these levels.
Kijun-sen and Senkou Span B lines are lines of the Ichimoku indicator transferred to the hourly timeframe from the 4-hour one.
Support and resistance areas are areas from which the price has repeatedly rebounded off.
Yellow lines are trend lines, trend channels and any other technical patterns.
Indicator 1 on the COT charts is the size of the net position of each category of traders.
Indicator 2 on the COT charts is the size of the net position for the non-commercial group.
Díky analytickým přehledům společnosti InstaForex získáte plné povědomi o tržních trendech! Jako zákazníkovi společnosti InstaForex je Vám k dispozici velký počet bezplatných služeb umožňujících efektivní obchodování.


