 Zůstat
Obchodní podmínky
Nástroje


Hello, dear traders!
The first trading day of a new week is exceptional as there is a lot of significant data, analyzing various currency pairs. First of all, this is due to the closing of the previous week and consideration of the appropriate time interval. The reasons for the US dollar dominance over its main rivals have been described enough in today's articles about currency pairs EUR/USD and GBP/USD. Therefore, I see no point in mentioning them once again. As for the USD/JPY pair, I suggest focusing on the technical picture of this trading instrument. Besides, concerning the close of trading on Friday, November 8-12, let's observe the weekly chart.
Weekly
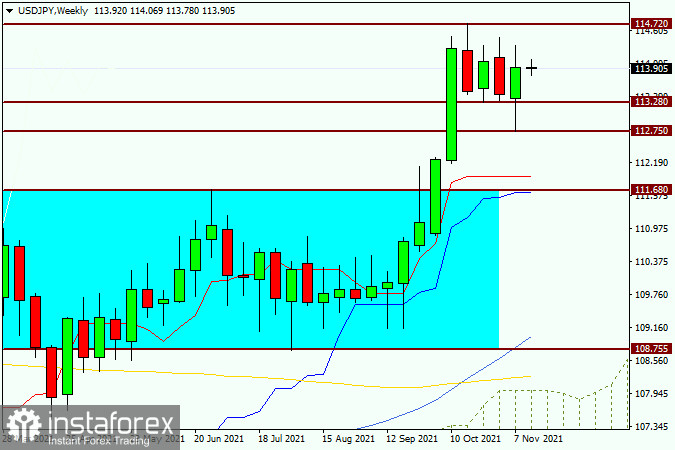
As mentioned above, the previous week was favourable for bulls regarding USD. The USD/JPY pair was rising last week, though at first not all aspects were appropriate for bullish players. As it is clearly shown in the weekly chart, USD/JPY initially fell to the strong technical level 112.75, where it found a strong support, and then reversed to the north. Consequently, the last trading day closed at 113.92. Besides, the support level at 113.28 was only pierced but not broken. This is a typical false break. Another technical feature is a long consolidation in the pair, which is marked with a blue rectangle. After that the market had to move to one of the directions of this range. Moreover, it moved in the north direction. Then, after a quite significant two-week rise the pair consolidated again and even tried to correct. However, the correction was limited by a technical, as well as all-time high 112.75.
Notably, this level had a dramatic impact on the price several times. Besides, the same situation occurred during last week's trading. Despite the pair's growth and a false break of the support at 113.28, the closing price on November 8-12 slightly worsened the technical picture as it was below another very significant level 114.00. To sum up the weekly timeframe, there is another consolidation in the range of 112.75-114.72. It is also indicated by alternating bullish and bearish candlesticks. According to the weekly chart, there are more chances for a further rise after the consolidation or correction in the sideways range is completed. However, consolidation above 114.00 and then breaking strong and significant resistance levels at 114.55 and 114.72, the last being the key one, is essential for a bullish scenario. In this pair bears have to plunge the quote to the significant technical level 113.00, after which they will re-test the support level 112.75. If this issue is completed and the pair consolidates below 112.75, a bearish scenario will be considered with the nearest target being another complicated level of 112.00.
Daily
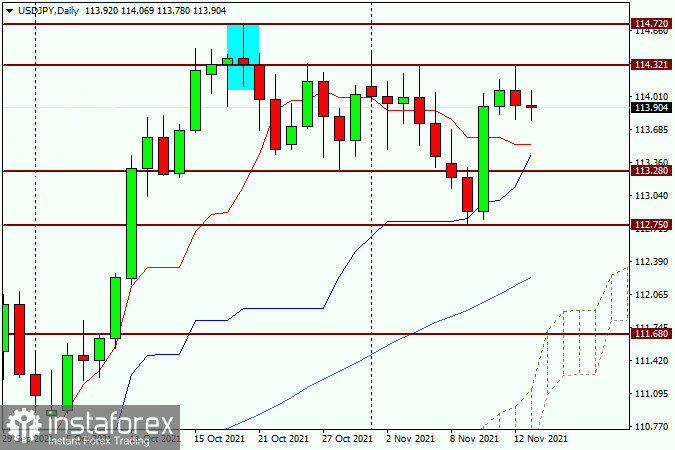
On the daily chart, it is shown that on the last trading day of the previous week bulls faced strong resistance from the sellers at 114.32. As clearly seen on the chart, this level had already provided considerable resistance to the pair on October 26. Daily support is indicated by the red Tenkan line, which is at 113.54. Below it, at 113.44, there is a blue Kijun line. They can stop the possible price decline. Bulls need to overcome the sellers' resistance at 114.32, then break the key resistance level at 114.72.
As for trading recommendations, I believe the main trading idea is buying, which is best considered after corrective rebounds to the price zone of 113.60-113.45. Buying below the resistance levels as well as near 114.00 is risky.
Good luck!
Díky analytickým přehledům společnosti InstaForex získáte plné povědomi o tržních trendech! Jako zákazníkovi společnosti InstaForex je Vám k dispozici velký počet bezplatných služeb umožňujících efektivní obchodování.

