 Zůstat
Obchodní podmínky
Nástroje


Analyzing trades on Tuesday
EUR/USD on M30 chart

On Tuesday, the EUR/USD pair showed signs of correction only in the first half of the day. However, the pair dropped rapidly later in the afternoon. And this time, there were no particular fundamental or macroeconomic reasons for this. There was one report in the US that might have triggered a rise in the US dollar. But the entire downward movement could not have been supported by this only report. Let's analyze the pair step by step. The downtrend line is still in place at the moment, so the downtrend also persists. At the bottom, we have only one level of 1.1259. The price was last seen near this price level more than a year ago. A bunch of macroeconomic statistics was published during the day, but the pair reacted only to the report on retail sales in the United States (the second tick mark in the illustration below). Retail sales in October exceeded traders' expectations. In addition, the volume of industrial production increased over the same period (the third tick). Yet, the report on the eurozone GDP and another speech by ECB head Christine Lagarde did not arouse any interest in the markets.
EUR/USD on M5 chart
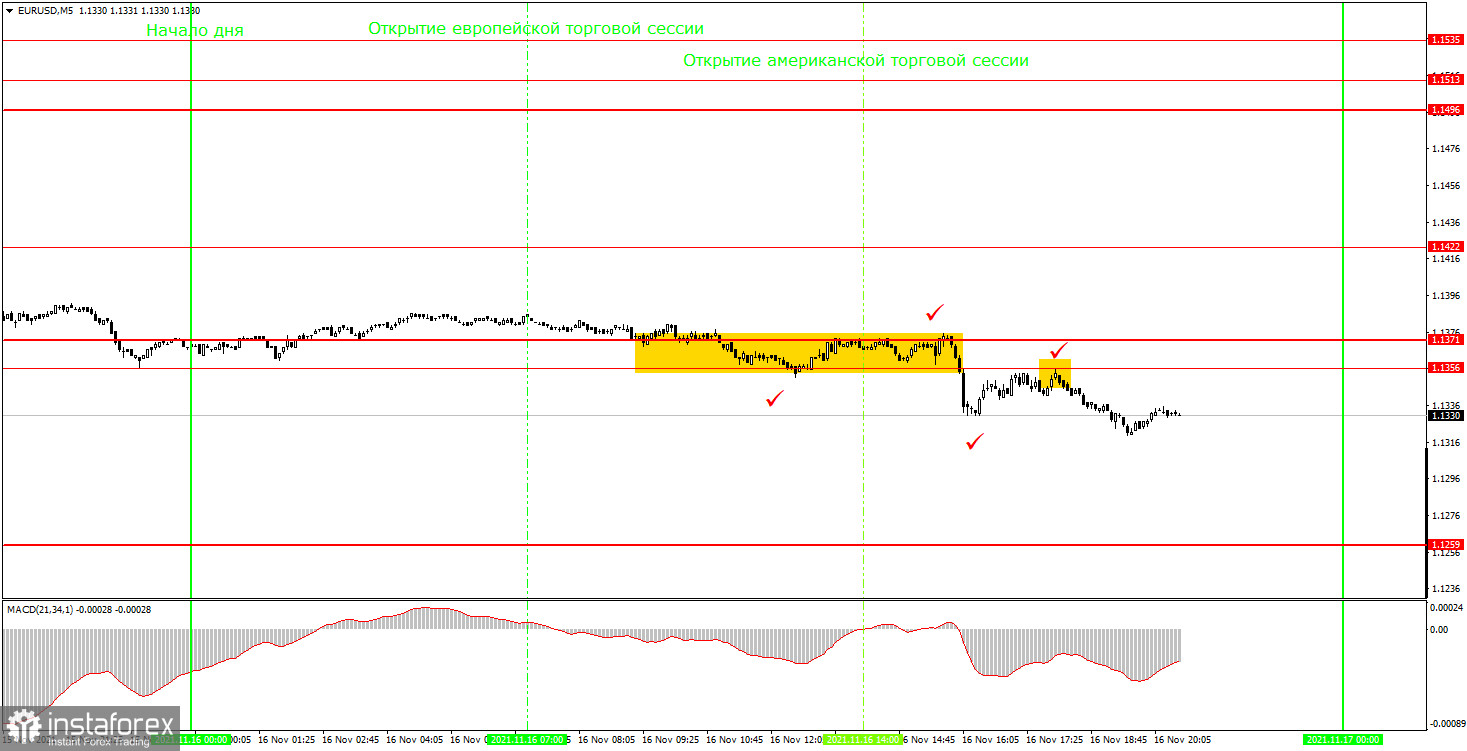
On the 5-minute time frame, the technical picture is rather uncertain. As you can see, the pair was trading flat throughout the day and started to move downwards only later in the evening. The illustration clearly shows that USD began to rise exactly after the publication of the US retail sales data (the second tick mark). Yet, the first rectangle on the chart does not indicate a flat channel; it rather serves as a sell signal. Since the levels of 1.1356 (yesterday's low) and 1.1371 were too close to each other, they should be considered together. Thus, the first sell signal was formed when the price consolidated below the level of 1.1356 and had almost completed the downward movement. However, a sell trade should have been opened 5 minutes earlier. Within 15-20 minutes after the publication of the retail sales report, it was already clear that the US dollar had a bullish bias and started to rise. Traders could take a risk and open a trade without waiting for the price to consolidate below 1.1356. In case beginners decided to wait for a clear consolidation, they should not have opened a trade after this signal, since the price had already declined by 40 pips at that time. It was possible to open short positions following a sell signal when the price rebounded from the level of 1.1356 but only in the case the first signal was not used. This means that the second signal should not have been followed if you had used the first one. In any case, the short position should have been closed manually an hour or two ago with a profit of 20-30 pips.
Trading tips on Wednesday
On the 30-minute time frame, the downtrend continues. Thus, you should definitely refrain from buying the pair until the price consolidates above the trendline. On the 5-minute time frame, the key levels for November 17 are found at 1.1259, 1.1356, 1.1371, and 1.1422. Take Profit should be set at a distance of 30-40 points. Stop Loss should be placed to a breakeven point as soon as the price passes 15 pips in the right direction. On the M5 chart, the nearest level could serve as a target unless it is located too close or too far away. If it is, then you should act according to the situation or trade with a Take Profit. On Wednesday, newcomers can pay attention to the report on inflation in the European Union and the next two speeches by Christine Lagarde. However, it is highly likely that the market will show no reaction to these events. Tomorrow, several minor reports will be released in the US and the Fed officials will give speeches.
Basic rules of trading
1) The signal strength is determined by the time the signal took to form (a bounce or a breakout of the level). The quicker it is formed, the stronger the signal is.
2) If two or more positions were opened near a certain level based on false signals (which did not trigger a Take Profit or test the nearest target level), then all subsequent signals at this level should be ignored.
3) When trading flat, a pair can form multiple false signals or not form them at all. In any case, it is better to stop trading at the first sign of a flat movement.
4) Trades should be opened in the period between the start of the European session and the middle of the US trading hours when all positions must be closed manually.
5) You can trade using signals from the MACD indicator on the 30-minute time frame only given that volatility is strong and there is a clear trend that should be confirmed by a trend line or a trend channel.
6) If two levels are located too close to each other (from 5 to 15 pips), they should be considered support and resistance levels.
On the chart
Support and Resistance Levels are the levels that serve as targets when buying or selling the pair. You can place Take Profit near these levels.
Red lines are channels or trend lines that display the current trend and show in which direction it is better to trade now.
The MACD indicator (14, 22, and 3) consists of a histogram and a signal line. When they cross, this is a signal to enter the market. It is recommended to use this indicator in combination with trend patterns (channels and trend lines).
Important announcements and economic reports that you can always find on the economic calendar can seriously influence the trajectory of a currency pair. Therefore, at the time of their release, we recommend trading as carefully as possible or exiting the market in order to avoid sharp price fluctuations.
Beginners on Forex should remember that not every single trade has to be profitable. The development of a clear strategy and money management is the key to success in trading over a long period of time.
Díky analytickým přehledům společnosti InstaForex získáte plné povědomi o tržních trendech! Jako zákazníkovi společnosti InstaForex je Vám k dispozici velký počet bezplatných služeb umožňujících efektivní obchodování.


