 Zůstat
Obchodní podmínky
Nástroje


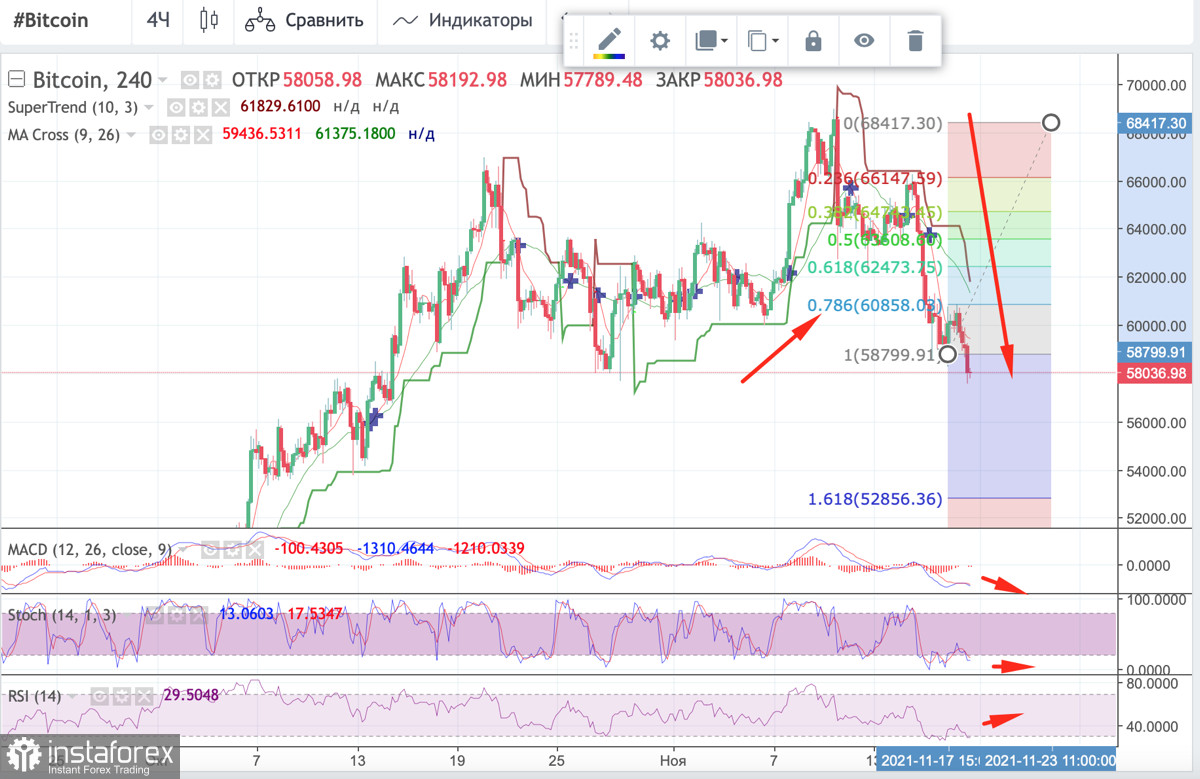
Bitcoin was steady above $60K owing to strong support at $58.7K where the price rebounded 3 times. The market rule, saying the more often a zone is tested, the more likely it is that the price breaks through it the next time it retests it, worked afterward. As a result, the quote fell to $58,2K. Moreover, BTC is expected to extend its downward movement. In other words, the coin is approaching the area where it may well bounce even from the support levels. To determine possible entry points, the movement of the cryptocurrency on the chart should be analyzed.
Consolidation is a period when a certain cryptocurrency is located within a narrow horizontal price channel. Usually, it indicates price stabilization or weakness of the trend (bullish or bearish).
Relative Strength Index (RSI) is a technical indicator that allows traders to determine the strength of a trend (bullish or bearish) and find out possible changes in the price movement. Owing to this indicator, it is possible to determine whether an asset is overbought or oversold. If it is a bullish trend, the indicator is located at 60. It indicates a high demand for the coin and the strength of the current upward momentum. When crossing this mark, the coin begins to move towards the overbought zone.
MACD (index of convergence/divergence of moving averages) is an indicator that allows traders to identify the trend based on the movement of moving averages and find the indicator's values between them. There is a bullish signal when the white line crosses the red one from below. Meanwhile, the bearish signal is produced when the white line crosses the red one from above.
Stochastic (Stochastic Oscillator) indicates the strength of the current prevailing trend. If the indicator is above 80, an asset can be considered overbought. If the Stochastic is below 20, then an asset is oversold.
Fibonacci levels are a technical analysis tool that indicates the possible support and resistance levels where price could potentially reverse direction.
According to the H4 chart, BTC broke the $58.7K barrier (the Fibonacci retracement level of 0.768). A breakout of such a strong support level produced a bearish signal. This means that the downward trend is likely to extend. The price also approached the next Fibonacci retracement level that ended at the lower boundary of a wide bearish range ($53K). In other words, the quote may well continue falling as the price usually moves from one level to the other. At the same time, BTC may encounter support on its way down. After a breakout at $58K, it will be important to analyze support areas because they could become levels of a potential reversal.
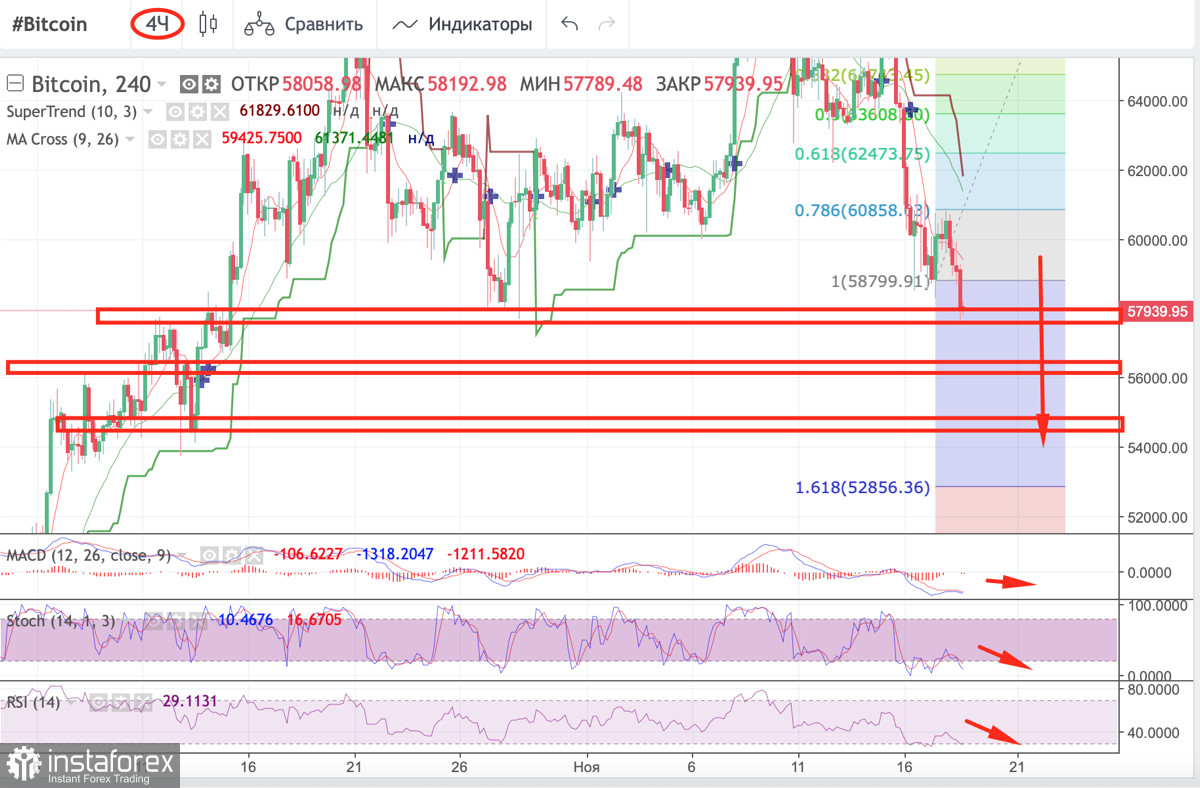
The main support lines on the H4 chart are $57.3K, $55.8K, and $54.1K. Long positions are concentrated at these levels. Apart from that, their volume is expected to increase. According to technical indicators, BTC is slowing down its movement. The MACD is below 0, while the Stochastic Oscillator and the RSI have reversed upward. This means that bulls have returned to the market. Consequently, the bullish trend could resume shortly, which is better seen on lower time frames where shadows of candlesticks show pressure on the price (shadows are below - bullish pressure, shadows are above - bearish pressure). Given all that, the quote could attempt to rebound soon. Bulls seem to be strong enough to stay above S1 ($57.3K). In such a case, a Stop-loss order could be placed at around $57.1K because the uptrend might be short-term and the downtrend to be long-term, which is signaled by the MACD.
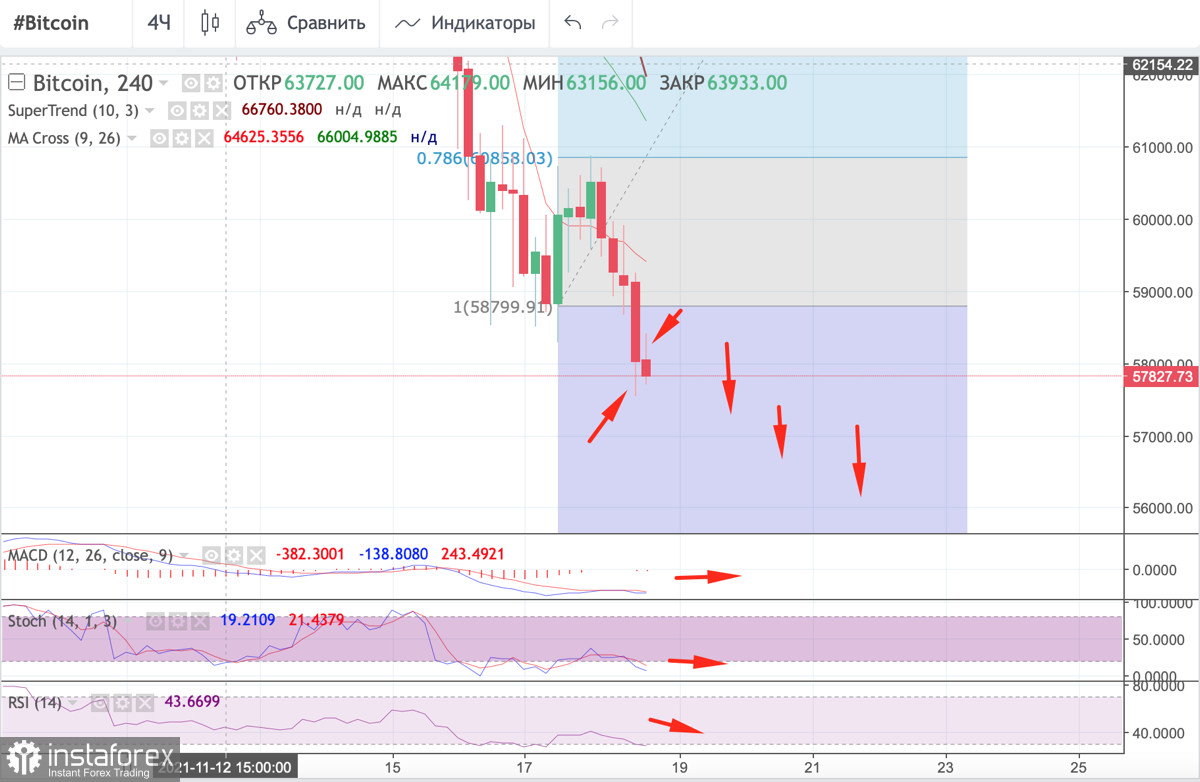
Against this backdrop, the price is likely to bounce from the strong support level of $57.3K. At the same time, in case of upward momentum, a Stop-loss order should be set. In addition, the first shadows of the bearish candlesticks started to emerge on the charts, indicating bullish activity. At the same time, it is too early to talk about the start of the uptrend as bulls are still weak. Therefore, it is important to closely monitor the charts. Long positions could be opened as soon as bulls get stronger. A breakout of the resistance level of $58.7K could also produce one more important bullish signal.
Díky analytickým přehledům společnosti InstaForex získáte plné povědomi o tržních trendech! Jako zákazníkovi společnosti InstaForex je Vám k dispozici velký počet bezplatných služeb umožňujících efektivní obchodování.

