 Zůstat
Obchodní podmínky
Nástroje


Here are the details of the economic calendar for November 19, 2021:
Last Friday, UK retail sales data were published from particularly important statistical data, the rate of decline of which remained at the level of -1.3%. On the one hand, the data is not the best, but on the other, it is predicted to accelerate to -2.0% in annual terms.
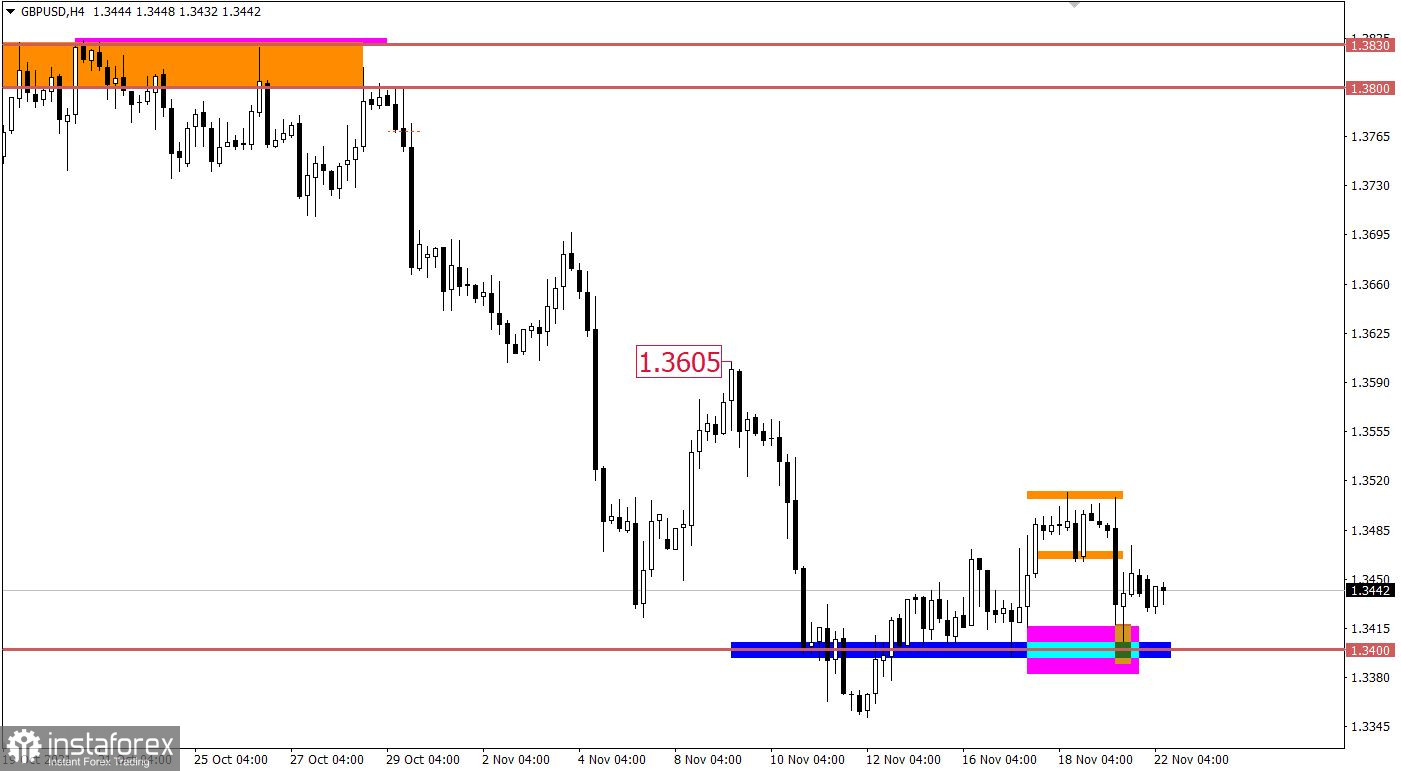
The pound continued to decline.
Analysis of trading charts from November 19:
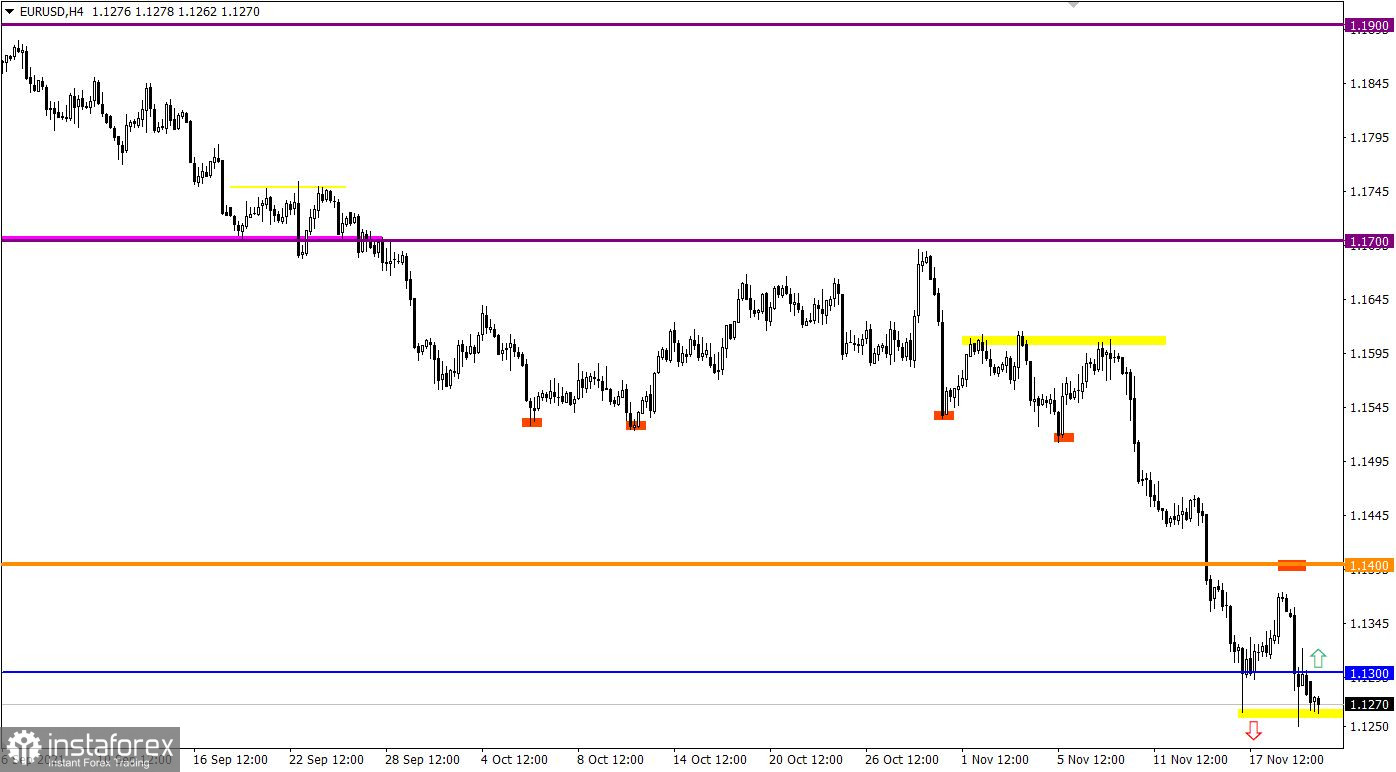
The European currency showed strong downward interest last Friday. As a result, the local low was updated on November 17, and the quote was in the area of 1.1250. In fact, a signal was received about the subsequent formation of a downward cycle, which has a scale of almost 1000 points since the beginning of June.
The trading plan on November 19 considered a downward movement, referring to the price rebound from the resistance area of 1.1400.
The GBP/USD pair has completed the construction of the sideways channel 1.3465/1.3510 by breaking through its lower border. As a result, the quote fell towards the support level of 1.3400, where a rebound naturally occurred.
The trading plan on November 19 considered the method of breaking one or another border of the established range. As a result, its lower limit was broken, and traders entered short positions at the best moment. The possible profit could be 40-50 points, which is $ 40-50 with a position volume of 1 Installot.

America's data on home sales in the secondary market will be published at 15:00 Universal time. Expectations are not the most optimistic as the volume should decrease by 1.0%, which indicates a gradual contraction of consumer activity, which has been growing quite actively lately. Moreover, it is so active that the decline in sales of not only real estate, but in any other, is expected for months.
If expectations are confirmed, the US dollar may well be under pressure.
Trading plan for EUR/USD on November 22:
The pivot variable is the level of 1.1250, relative to which the stagnation occurred. The subsequent growth in the volume of short positions will happen when the price is kept below the level of 1.1240 in a four-hour period. This will indicate the prevailing downward interest.
Traders will consider an alternative scenario in the event of a natural rebound. A buy signal will be relevant if the price is kept above the level of 1.1300.
A candlestick chart view is graphical rectangles of white and black light, with sticks on top and bottom. When analyzing each candle in detail, you will see its characteristics of a relative period: the opening price, closing price, and maximum and minimum prices.
Horizontal levels are price coordinates, relative to which a stop or a price reversal may occur. These levels are called support and resistance in the market.
Circles and rectangles are highlighted examples where the price of the story unfolded. This color selection indicates horizontal lines that may put pressure on the quote in the future.
The up/down arrows are the reference points of the possible price direction in the future.
Díky analytickým přehledům společnosti InstaForex získáte plné povědomi o tržních trendech! Jako zákazníkovi společnosti InstaForex je Vám k dispozici velký počet bezplatných služeb umožňujících efektivní obchodování.


