 Zůstat
Obchodní podmínky
Nástroje


GBP/USD 5M
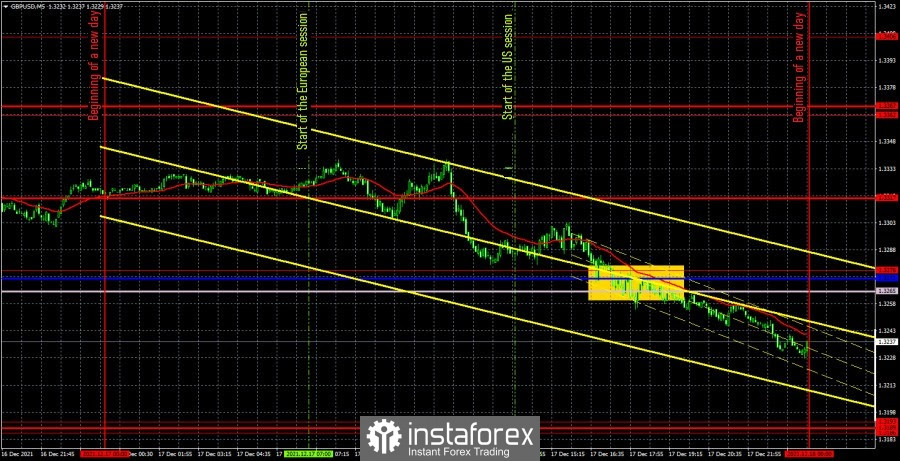
The GBP/USD pair also traded very well on Friday and went from a high to a low of 110 points. Just as in the case of the euro/dollar pair, there were practically no important reports in the two countries of interest to the pair. Only in the UK, a retail sales report was published early in the morning, which turned out to be better than forecasts and, accordingly, should have provoked the pound's growth, not its fall. But, as we can see, for most of the day, the pound fell along with the euro currency. Thus, we believe that in this way, the pair simply played back the movement that happened immediately after the announcement of the results of the meetings of the Federal Reserve and the Bank of England. After all, now, by and large, the pair is located at the levels at which it was before the meetings of the two central banks. Thus, nothing has changed in technical terms. There were practically no trading signals during Friday either, despite a fairly good and trending movement. The chart of the hourly timeframe will clearly show that the pair has returned to the horizontal channel again, so there are few levels from which signals can be expected to form in this zone. The sell signal was formed when the pair overcame the Senkou Span B and Kijun-sen lines together with the extreme level of 1.3276. However, it was formed quite late, so it was no longer necessary to work it out. Although the signal itself turned out to be profitable, those traders who still opened deals on it received several dozen points of profit.
GBP/USD 1H
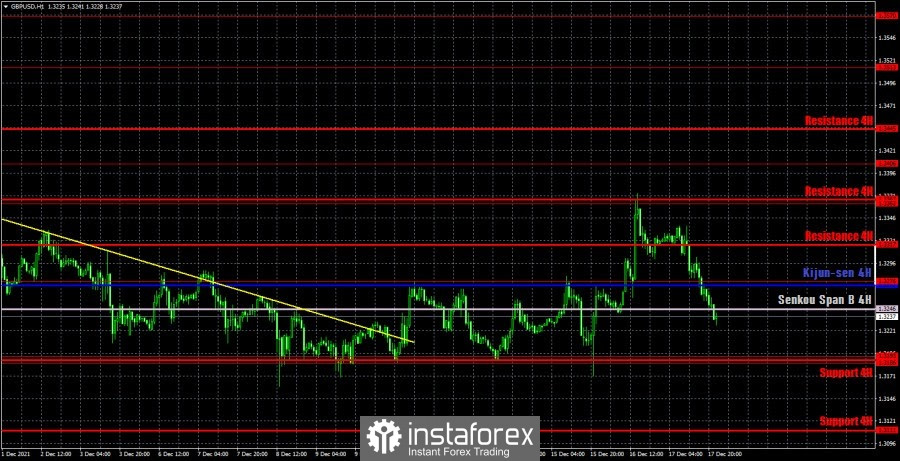
On the hourly timeframe, the pound/dollar pair is also inside the horizontal channel, if we exclude the movement on Wednesday evening and Thursday, thanks to which the pair rose to the level of 1.3362. However, on Friday everything returned to normal, and the bulls were unable to build on their success. Therefore, now the pound's quotes are again between the levels of 1.3186 and 1.3276. The fact that the price has settled below two important lines of the Ichimoku indicator indicates a very likely fall to the level of 1.3186. We highlight the following important levels on December 20: 1.3186 - 1.3193, 1.3276, 1.3362. There are no levels below, as the price has not been so low for more than a year. The Senkou Span B (1.3246) and Kijun-sen (1.3272) lines can also be signal sources. Signals can be "rebounds" and "breakthroughs" of these levels and lines. It is recommended to set the Stop Loss level to breakeven when the price passes in the right direction by 20 points. The lines of the Ichimoku indicator can move during the day, which should be taken into account when searching for trading signals. There won't be a single interesting event or publication in either the UK or the US on Monday. Thus, volatility is likely to be weaker than on Friday. And the fact that Christmas Week begins increases the likelihood of maintaining a horizontal channel.
We recommend you to familiarize yourself:
Forecast and trading signals for EUR/USD for December 20. Detailed analysis of the movement of the pair and trade deals.
COT report

The mood of commercial traders was much more bearish during the last reporting week (December 7-13). Commercial traders closed 6,700 sell contracts (shorts) and 20,100 buy contracts (longs) during the week. Thus, the net position for the "non-commercial" group of traders decreased by 13,400 contracts, which is a lot for the pound. Thus, unlike the euro currency, the pound, according to COT reports, continues to fall quite reasonably: major players continue to sell it. However, the green and red lines of the first indicator (which mean the net positions of the non-commercial and commercial groups) have already moved far away from each other. Recall that such a deletion signals the imminent end of the trend. However, as with any fundamental assumptions, specific technical signals are required to work out this hypothesis, which are not currently available. If we do not take into account the increase in the key rate by the Bank of England, then there are no special fundamental reasons for the growth of the pound now either. Recall that Prime Minister Boris Johnson continues to get into various scandals in Great Britain and there is already talk that he will leave his post before the end of the deadline. The pandemic in the UK is gaining momentum and the other day an anti-record was set for the daily number of infections. Omicron is also spreading quite rapidly across the country, creating additional risks for the healthcare system and the economy. London, on the other hand, cannot find a common language with Paris and Brussels, which threatens it with the deterioration of relations with its closest neighbors and the loss of markets for the sale of products. But there is no positive news.
Explanations for the chart:
Support and Resistance Levels are the levels that serve as targets when buying or selling the pair. You can place Take Profit near these levels.
Kijun-sen and Senkou Span B lines are lines of the Ichimoku indicator transferred to the hourly timeframe from the 4-hour one.
Support and resistance areas are areas from which the price has repeatedly rebounded off.
Yellow lines are trend lines, trend channels and any other technical patterns.
Indicator 1 on the COT charts is the size of the net position of each category of traders.
Indicator 2 on the COT charts is the size of the net position for the non-commercial group.
Díky analytickým přehledům společnosti InstaForex získáte plné povědomi o tržních trendech! Jako zákazníkovi společnosti InstaForex je Vám k dispozici velký počet bezplatných služeb umožňujících efektivní obchodování.

