 Zůstat
Obchodní podmínky
Nástroje


The macroeconomic calendar yesterday was empty. No important statistics were released from Europe, Britain, and the United States. In terms of the information background, there is a stream of news about the alarming rate of spread of the Omicron strain and the possible introduction of a new lockdown in Europe and the UK.
This is a negative information background, but the market is still showing low activity, possibly due to the upcoming holidays.
Analysis of trading charts from December 21:
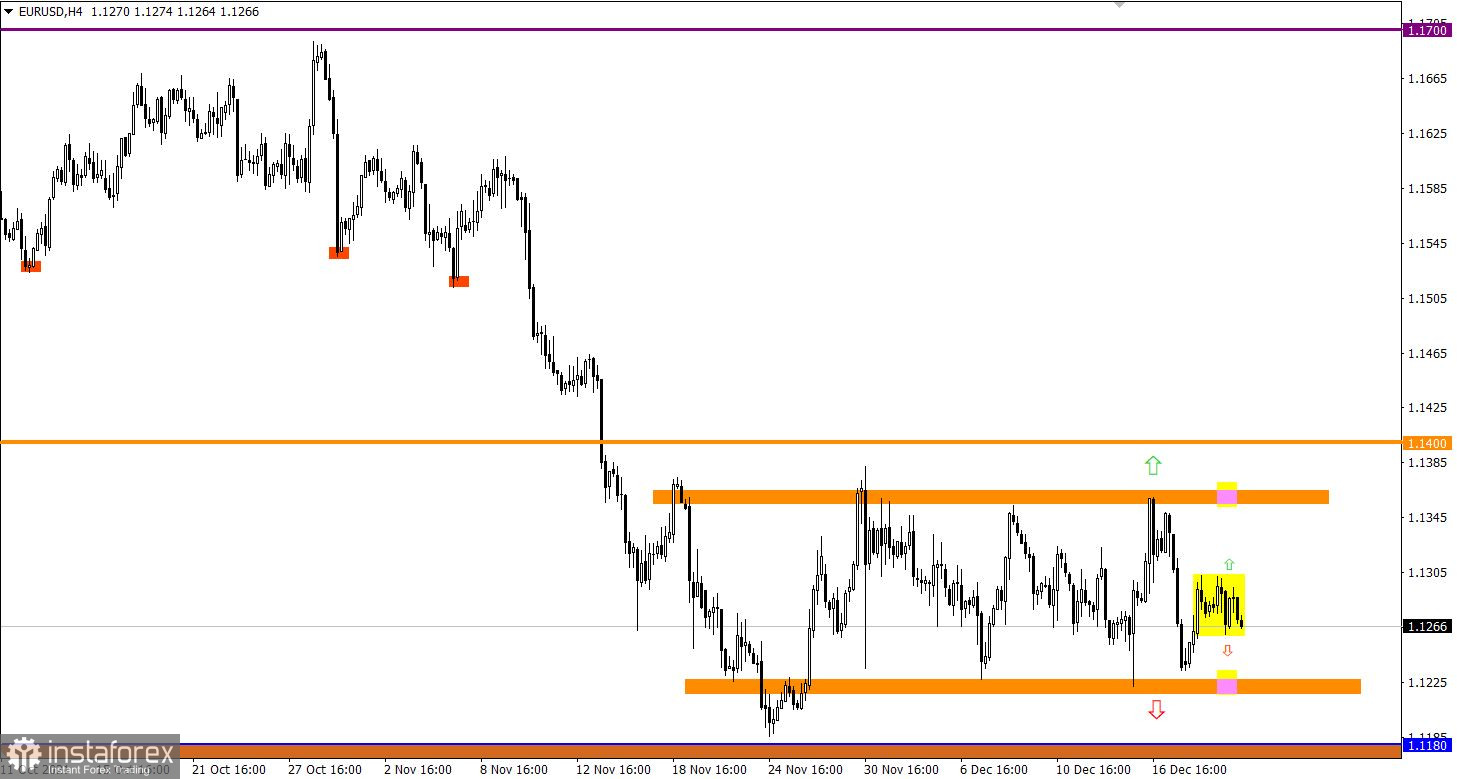
The EUR/USD pair has been moving in the 1.1225/1.1355 side channel for almost a month, signaling the accumulation of trading forces in the market. This process has led to abundant attention from speculators, who sometimes show activity in the form of impulse price surges within the established range.
The downward trend remains on the daily chart. A flat appeared in its structure, which only slowed down the sellers temporarily.
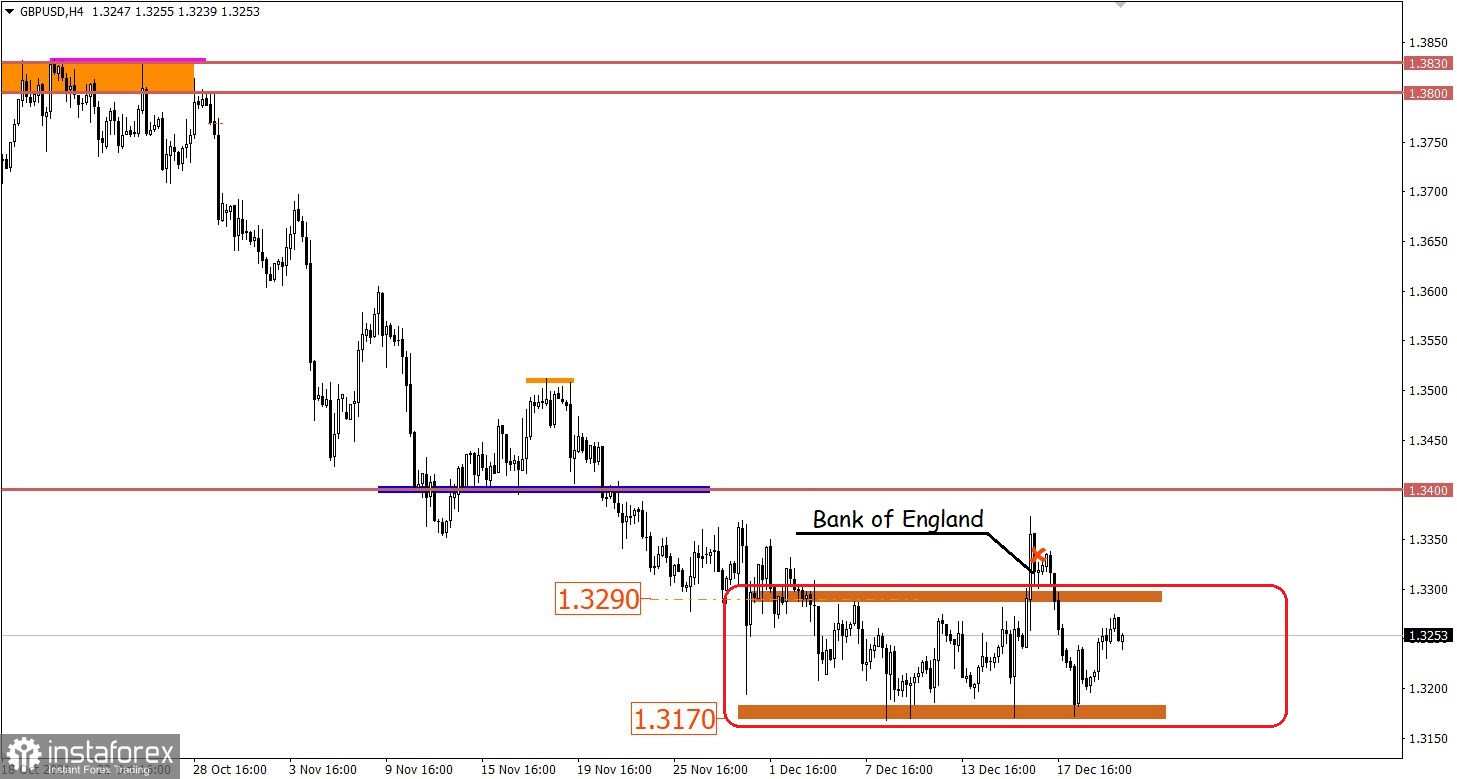
A weak upward move on the GBP/USD pair returned the quote to the upper limit of the previously set range of 1.3170/1.3290 while indicating that traders are not yet ready for strong price changes that could lead to drastic changes in market ticks.

December 22 economic calendar:
The UK's GDP data for the third quarter has already been published, which confirmed a slowdown in economic growth from 23.6% to 6.8%. Although the data came out slightly better than the preliminary estimate, the pound sterling was not particularly optimistic about it.
The United States is also expected to publish its GDP data, with a slowdown forecast from 12.2% to 4.9%. Since the data are final and to a greater extent already taken into account in the quote, it is unlikely that they will affect anything.
The US will also publish data on home sales in the secondary market, which may grow by 2.7%. This might slightly diversify the news stream, but anything drastic change should not be expected from it.
Time targeting
UK GDP - 7:00 Universal time
US GDP - 13:30 Universal time
US sales in the secondary housing market - 3:00 Universal time
Trading plan for EUR/USD on December 22:
The activity in the market on it is minimal due to the upcoming Christmas holidays. This leads to local stagnation within the established flat.
A good example here is the previous day, where market participants were caught in a narrow range of 1.1260/1.1303. As a result, stagnation is likely to lead to acceleration towards one of the borders of the main flat.
The trading strategy is described in the chart below.
Trading plan for GBP/USD on December 22:
The side channel is still relevant in the market, so traders are primarily focused on the tactics of a price rebound from its borders. At the same time, it should be noted that the flat is only a local manifestation of the market, and it will end sooner or later. This will cause high activity in the market, which will lead to local increases. In this case, the tactics of trading on the breakdown of a particular border will be the most successful.
A candlestick chart view is graphical rectangles of white and black light, with sticks on top and bottom. When analyzing each candle in detail, you will see its characteristics of a relative period: the opening price, closing price, and maximum and minimum prices.
Horizontal levels are price coordinates, relative to which a stop or a price reversal may occur. These levels are called support and resistance in the market.
Circles and rectangles are highlighted examples where the price of the story unfolded. This color selection indicates horizontal lines that may put pressure on the quote in the future.
The up/down arrows are the reference points of the possible price direction in the future.
Díky analytickým přehledům společnosti InstaForex získáte plné povědomi o tržních trendech! Jako zákazníkovi společnosti InstaForex je Vám k dispozici velký počet bezplatných služeb umožňujících efektivní obchodování.

