 Zůstat
Obchodní podmínky
Nástroje


The GBP/USD pair resumed its bull run on Wednesday. Yet, it was not able to break through the upper limit of the sideways range (1.3268) a day earlier. Unlike, EUR/USD, the pair found a reason to leave the sideways range. So, a new uptrend is likely to start. The British pound soared by 100 pips on Wednesday. There could be two possible reasons for that - strong fundamentals and a sharp change in market sentiment. Speaking of fundamentals, the GDP reports for the 3 quarter came out in the United Kingdom and the United States on Wednesday. However, the UK's GDP was unlikely to boost the pair because the reading fell compared to the previous estimate. So, the pound sterling was supposed to show a decline instead of a rise. Another reason could be that Boris Johnson said there would be no lockdown before Christmas. This means that the economy will remain open during another wave of COVID-19.
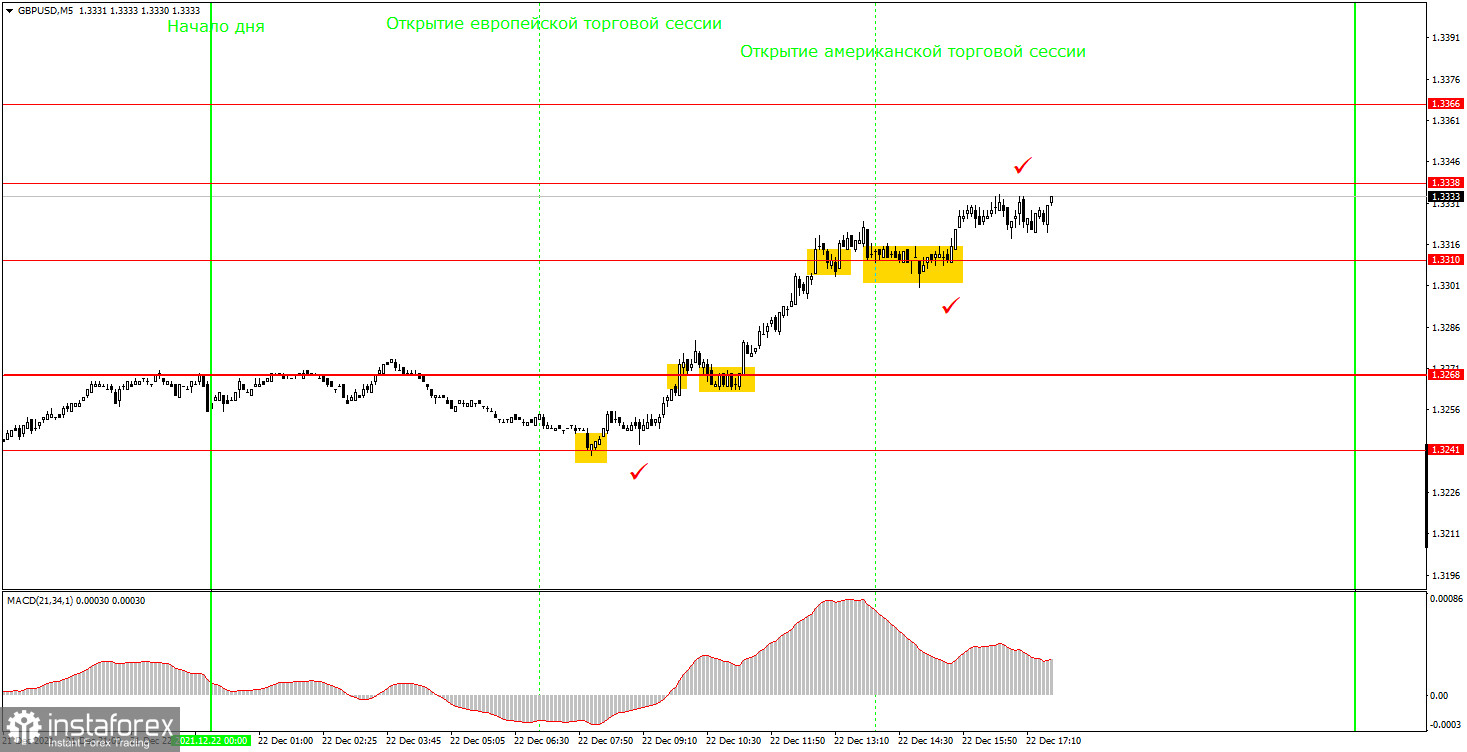
The pound/dollar pair showed strong-enough movement on Wednesday, according to the M5 chart. A one way trend movement without frequent pullbacks is always good. The first buy signal was produced as soon as the pair rebounded from 1.3241 and went up. So, it was the right moment for beginners to open long positions. The quote then broke through 1.3268 and 1.3310. All that time, novice traders were supposed to hold long positions. By the end of the trading day, the pair broke through 1.3338, and it was time to lock in profits. The pair surged by 90 pips by that point. So, beginners could earn substantial profit and offset recent losses. A long position could be closed by any Take Profit and bring a trader a 40-50 pips profit.
The pair has left the sideways channel and a new uptrend is now forming, according to the M30 chart. Traders should consider long positions as long as the quote is above the new trend line. Despite the pre-holiday time, market players have found a reason for active trading. The key levels on the M5 chart are 1.3268, 1.3310, 1.3338, 1.3366, and 1.3407-1.3416. Traders could trade based on these levels on Thursday. The price could either pull back or break through them. A take-profit order is to be set at a distance of 40-50 pips. On the M5 chart, all the nearest levels could be seen as targets. At the same time, when you lock in profits, you should take into account the strength of the movement. A stop-loss order should be placed at the breakeven point when the quote passes 20 pips in the required direction. The UK's macroeconomic calendar will be empty on December 23. The reports set to be published in the US on Thursday are unlikely to somehow affect the market.
1) The strength of a signal is calculated by the time it took a signal to form (bounce or break through a level). The less time it takes, the stronger is the signal.
2) If two or more trades are opened near a certain level based on false signals (that did not trigger a Take Profit order or a test of the nearest target level), then all subsequent signals from this level should be ignored.
3) Being flat, any pair might form a lot of false signals or non at all. In any case, when seeing the first signs of a flat, trading should be stopped.
4) Trades are opened within the time period between the opening of the European session and the middle of the North American session when all trades should be closed manually.
5) On the M30 chart, trading should be carried out based on signals from the MACD indicator only if there is good volatility or a trend confirmed by a trend line or a channel.
6) If two levels are located close to one another (from 5 to 15 pips), they should be considered as the area of support or resistance.
Support and resistance are target levels when buying or selling a pair. A Take-profit order could be set near them.
Red lines are channels or trend lines that display the current trend and show in what direction it is preferable to trade now.
MACD is a histogram and a signal line, the crossing of which produces a signal to enter the market. It should be used in combination with trend patterns (channels, trend lines).
Important speeches and reports (always contained in the calendar) can greatly influence the movement of a currency pair. Therefore, at the time of publication, market players should trade very cautiously or exit the market to avoid a reversal.
Beginners should remember that not every trade will be profitable. An effective trading strategy and money management are the keys to success in long-term trading.
Díky analytickým přehledům společnosti InstaForex získáte plné povědomi o tržních trendech! Jako zákazníkovi společnosti InstaForex je Vám k dispozici velký počet bezplatných služeb umožňujících efektivní obchodování.

