 Zůstat
Obchodní podmínky
Nástroje


America's durable goods orders rose 2.5% in November, which is better than the forecast of 1.6%. At the same time, the US unemployment figures were published, where they recorded a slight decrease in their volume due to the revision of the previous data.
Details of statistics:
The volume of initial applications for benefits remained at the level of 205 thousand.
The volume of repeated applications for benefits decreased from 1,867 thousand to 1,859 thousand.
In general, the US data is not bad, but the market behaved speculatively. The US currency strengthened against competitors at first, then weakened.
Analysis of trading charts from December 23:
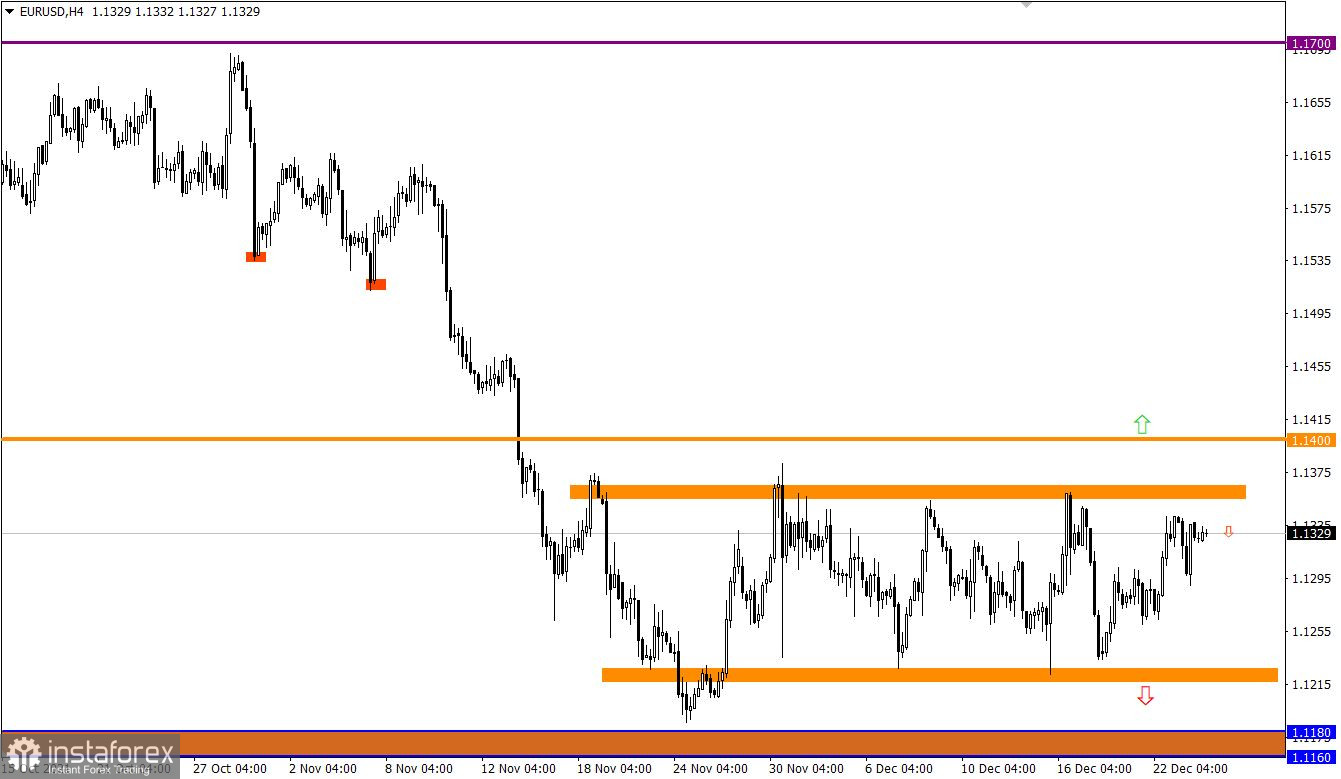
The EUR/USD pair has been moving in the side channel of 1.1225/1.1355 since the beginning of December, consistently working out the set borders. The price's prolonged presence in a closed amplitude led to the accumulation of trading forces. In turn, this focuses a lot of speculators' attention on itself.
The trading recommendation on December 23 has developed accurately. So the initial price rebound from the upper border of the flat led us to the level of 1.1290, where a profit-taking order was placed in advance.
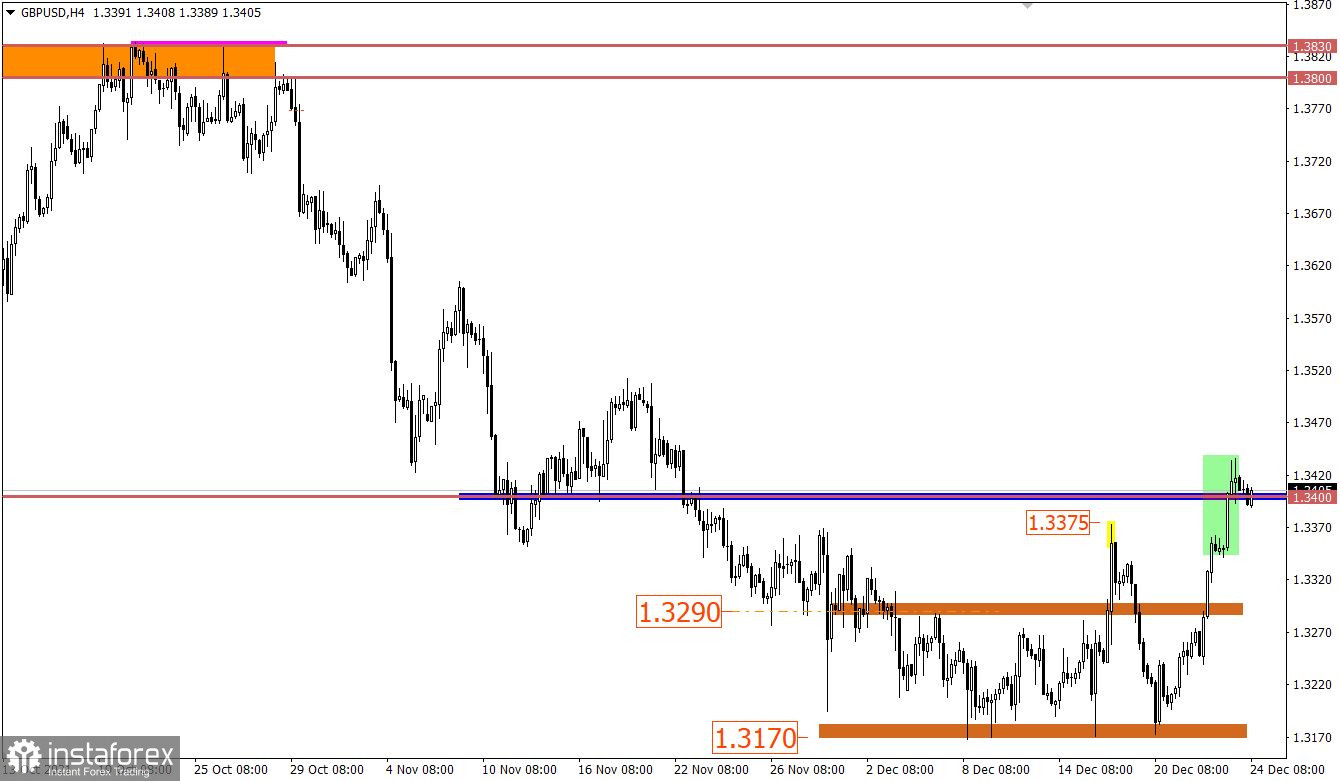
Since the current trading week started, the pound has shown high speculative interest against the US dollar. This led to its strengthening of more than 250 points from the rebound point of 1.3170. The price area 1.3400/1.3420 acts as resistance towards speculators, which put pressure on long positions and eventually led to their reduction.
The trading recommendation on December 23 considered the possibility of a subsequent growth in case the price is held above the level of 1.3375. A price consolidation was carried out in the area of the level 1.3400.

December 24 economic calendar:
It is a day off today in the United States, Great Britain, Germany, Italy, Spain, and Switzerland to celebrate Christmas and early closure in the remaining countries of Europe. In this case, the market will be dominated by low activity due to the lack of trading volumes.
Trading plan for EUR/USD on December 24:
The price movement within the side channel is still relevant in the market. Thus, the most appropriate trading tactic is considered to be the method of rebounding from the set borders.
Next week, traders will consider declining towards the lower border of the channel.
As for the trading tactics on the breakdown of the flat borders, we monitor the fixing points of the price outside the established levels in a four-hour period.
Trading plan for GBP/USD on December 24:
The resistance area of 1.3400/1.3420 is still putting pressure on buyers, which led to a slight pullback followed by stagnation. Since major players are not around in the market, further stagnation is possible, but traders may consider a partial recovery of dollar positions next week.
A candlestick chart view is graphical rectangles of white and black light, with sticks on top and bottom. When analyzing each candle in detail, you will see its characteristics of a relative period: the opening price, closing price, and maximum and minimum prices.
Horizontal levels are price coordinates, relative to which a stop or a price reversal may occur. These levels are called support and resistance in the market.
Circles and rectangles are highlighted examples where the price of the story unfolded. This color selection indicates horizontal lines that may put pressure on the quote in the future.
The up/down arrows are the reference points of the possible price direction in the future.
Díky analytickým přehledům společnosti InstaForex získáte plné povědomi o tržních trendech! Jako zákazníkovi společnosti InstaForex je Vám k dispozici velký počet bezplatných služeb umožňujících efektivní obchodování.


