 Zůstat
Obchodní podmínky
Nástroje


Trend analysis (Fig. 1).
The market may move down on Tuesday from the level of 1.3438 (closing of yesterday's daily candle) to the target level of 1.3396, the 14.6% retracement level (red dotted line). When testing this level, the price may move upward to the target level of 1.3481, the historical resistance level (blue dotted line).
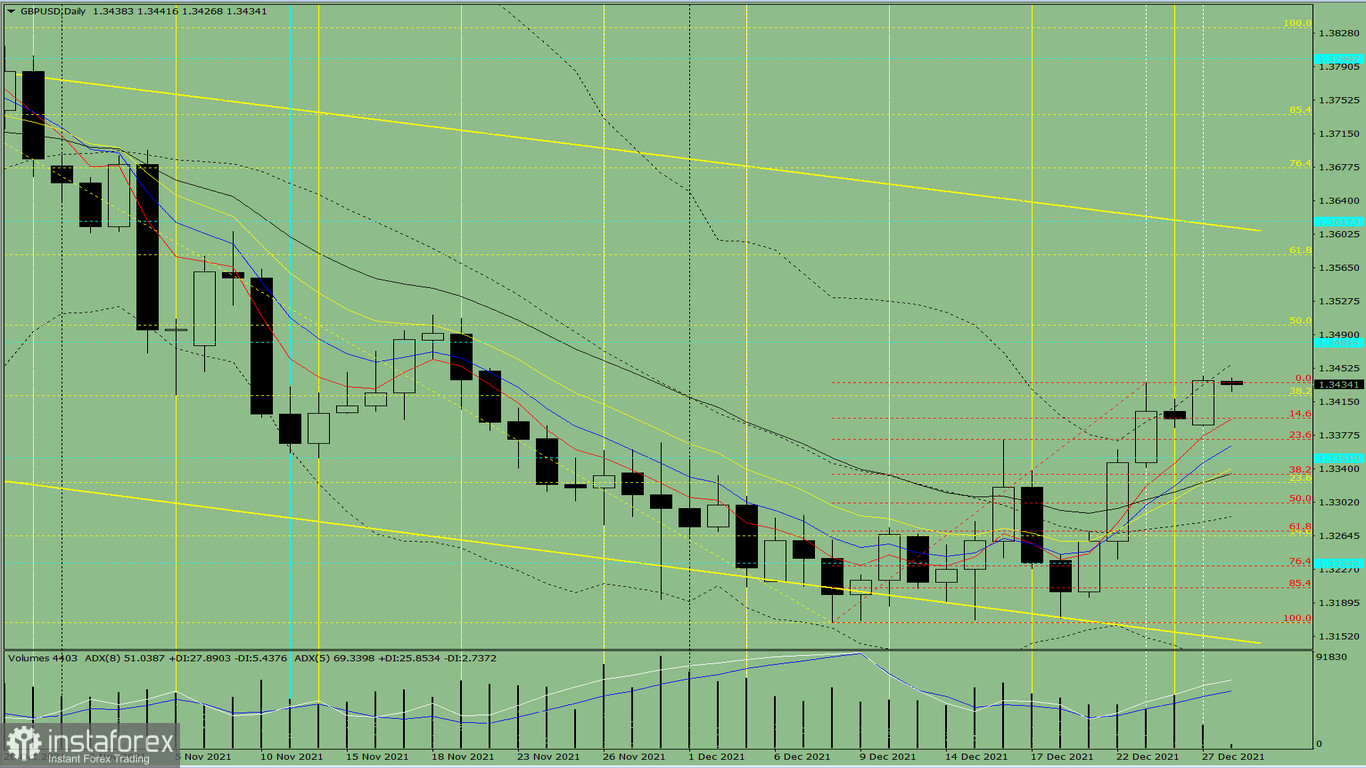
Fig. 1 (daily chart)
Comprehensive analysis:
- Indicator analysis - up;
- Fibonacci levels - up;
- Volumes - up;
- Candlestick analysis - up;
- Trend analysis - up;
- Bollinger lines - up;
- Weekly chart - up.
General conclusion:
The price may move down from the level of 1.3438 (closing of yesterday's daily candle) to the target level of 1.3396, the 14.6% retracement level (red dotted line). When testing this level, the price may move upward to the target level of 1.3481, the historical resistance level (blue dotted line).
Alternative scenario: from the level of 1.3438 (closing of yesterday's daily candle), the price may move upwards to the target level of 1.3481, the historical resistance level (blue dotted line).
Díky analytickým přehledům společnosti InstaForex získáte plné povědomi o tržních trendech! Jako zákazníkovi společnosti InstaForex je Vám k dispozici velký počet bezplatných služeb umožňujících efektivní obchodování.


