 Zůstat
Obchodní podmínky
Nástroje


Trend analysis
The price from the level of 1.1384 (closing of the last weekly candle) may begin to decline to the target of 1.1305 – the historical support level (blue dotted line) this week. If this level is tested, it may move up to the target of 1.1440 – the pullback level of 23.6% (blue dotted line).
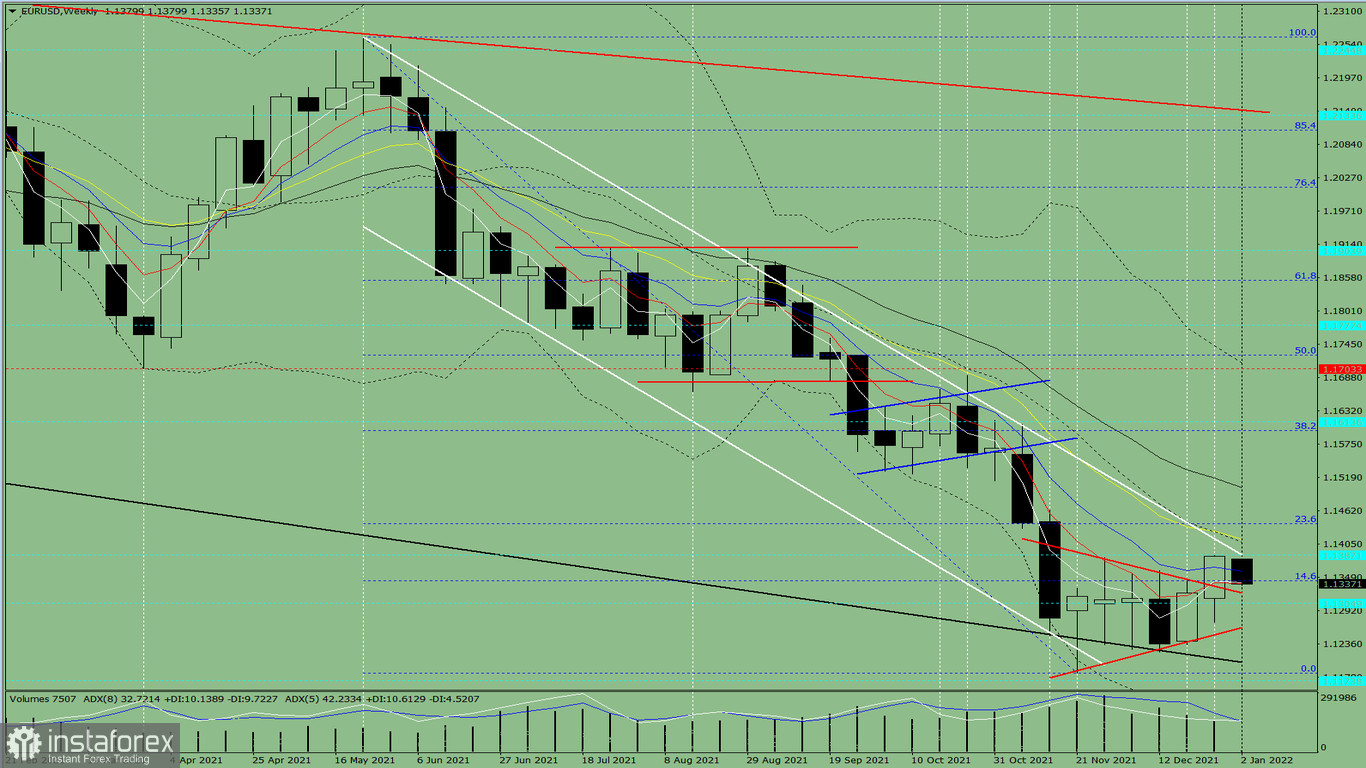
Fig 1 (weekly chart)
Comprehensive analysis:
A downward movement can be concluded based on a comprehensive analysis.
The overall result of the candlestick calculation based on the weekly chart: the price will most likely move in a downward trend without an upper shadow (Monday - down) and with a lower shadow (Friday - up) in the weekly black candlestick.
This week, the price from the level of 1.1384 (closing of the last weekly candle) may start declining to the target of 1.1305 – the historical support level (blue dotted line). After testing it, the upward movement will continue to the target of 1.1440 – the pullback level of 23.6% (blue dotted line).
Alternatively, the price from the level of 1.1384 (closing of the last weekly candle) may start moving down to reach the level of 1.1305 – the historical support level (blue dotted line). Once this level is reached, it may further decline to the target of 1.1263 – the support line (red bold line) and then rise again.
Díky analytickým přehledům společnosti InstaForex získáte plné povědomi o tržních trendech! Jako zákazníkovi společnosti InstaForex je Vám k dispozici velký počet bezplatných služeb umožňujících efektivní obchodování.


