 Zůstat
Obchodní podmínky
Nástroje


GBP/USD 5M

The GBP/USD currency pair traded much more actively than the EUR/USD pair on Wednesday. Although on closer examination it becomes clear that the volatility was only around 60 points, which is about the same for the pound as 40 points for the euro currency. Therefore, in this case, we can also talk about a very weak movement. But, as in the case of the euro, an upward movement. It can be said that both main pairs moved in the same way. One small "but"! There was a fairly strong macroeconomic background for the British currency on Wednesday. However, only one important report was published – on inflation in the UK for December. It was published at 7 a.m. GMT and for about an hour and a half after its release, the British currency was falling, not rising. Thus, we strongly doubt that the markets worked out this report, which, in theory, should have provoked the pound's growth, since the forecast value was exceeded. And rising inflation increases the likelihood of a new tightening of monetary policy by the Bank of England. Therefore, this is a bullish factor for the pound. One way or another, but the pound rose in price at the end of the day. The rebound from the Senkou Span B line was important. It is most clearly visible on the 4-hour TF, since throughout today this line has constantly changed its location, which cannot be displayed on the lower TF. However, the price bounced off this line and is now between it and the Kijun-sen line. For the further fall of the British currency, overcoming the Ichimoku cloud is required. As for trading signals, only one was formed during the past day. The price traded for several hours between Senkou Span B and the level of 1.3607 in the European session, which, coupled with the level of 1.3598, formed a support area. The price failed to settle below this support area, and when there was a consolidation above it, traders could buy the pair. As already mentioned, the volatility was low, so it was not possible to earn a lot. In total, after the formation of a buy signal, the price went up 33 points. Nevertheless, this is at least some profit. Better than nothing.
We recommend to familiarize yourself with:
Forecast and trading signals for GBP/USD on January 20. Detailed analysis of the movement of the pair and trading transactions.
COT report
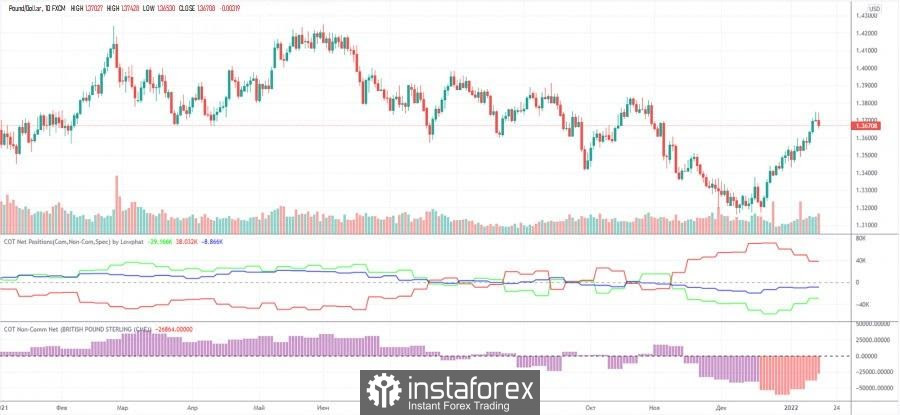
Recall the situation with Commitment of Traders (COT) reports on the euro currency. The picture with the British pound is exactly the opposite. Here, the green and red lines (indicating the net positions of non-commercial and commercial traders) have moved away from each other a couple of weeks ago, which is a signal of the possible end of the trend. That's exactly what happened. At the moment, these lines are converging, so we believe that the upward momentum of the British pound has not been exhausted. The mood of professional traders remains bearish, but at the same time, the trend should be taken into account here. And the trend now is to reduce the difference between the two categories of players. In other words, the bearish mood is weakening. Thus, we believe that after a slight pullback downwards, the growth of the British currency will resume.
GBP/USD 1H

You can see how a new downward trend is emerging on the hourly timeframe. Unless, of course, it is it, and not just a stronger correction than before. We still hope that once the upward trend line has been overcome, a downward trend will still be formed. However, so far, an attempt to overcome the Senkou Span B line can be called unsuccessful. Thus, we must now wait for a new attempt to overcome this line so that the expectations of a new fall in the pound are confirmed. We highlight the following important levels on January 20: 1.3489, 1.3598-1.3607, 1.3667, 1.3741. The Senkou Span B (1.3602) and Kijun-sen (1.3660) lines can also be signal sources. Signals can be "bounces" and "breakthroughs" of these levels and lines. It is recommended to set the Stop Loss level to breakeven when the price passes in the right direction by 20 points. The lines of the Ichimoku indicator can move during the day, which should be taken into account when determining trading signals. There are no interesting events scheduled in the UK for Thursday, as well as in the US. But this does not mean that the pound will stand still and cannot resume falling or rising. As we have already figured out above, traders are now paying a little attention to statistics and the "foundation". Yesterday, in particular, they also ignored the speech of Bank of England Chairman Andrew Bailey.
Explanations for the chart:
Support and Resistance Levels are the levels that serve as targets when buying or selling the pair. You can place Take Profit near these levels.
Kijun-sen and Senkou Span B lines are lines of the Ichimoku indicator transferred to the hourly timeframe from the 4-hour one.
Support and resistance areas are areas from which the price has repeatedly rebounded off.
Yellow lines are trend lines, trend channels and any other technical patterns.
Indicator 1 on the COT charts is the size of the net position of each category of traders.
Indicator 2 on the COT charts is the size of the net position for the non-commercial group.
Díky analytickým přehledům společnosti InstaForex získáte plné povědomi o tržních trendech! Jako zákazníkovi společnosti InstaForex je Vám k dispozici velký počet bezplatných služeb umožňujících efektivní obchodování.


