 Zůstat
Obchodní podmínky
Nástroje


Trend analysis
This week, the price is expected to fall from the level of 1.3549 (closing of the last weekly candle) to the target of 1.3457 – the pullback level of 50% (red dotted line). After reaching this level, the upward movement will start to the target of 1.3596 – the pullback level of 38.2% (yellow dotted line), from which it is possible to further rise.
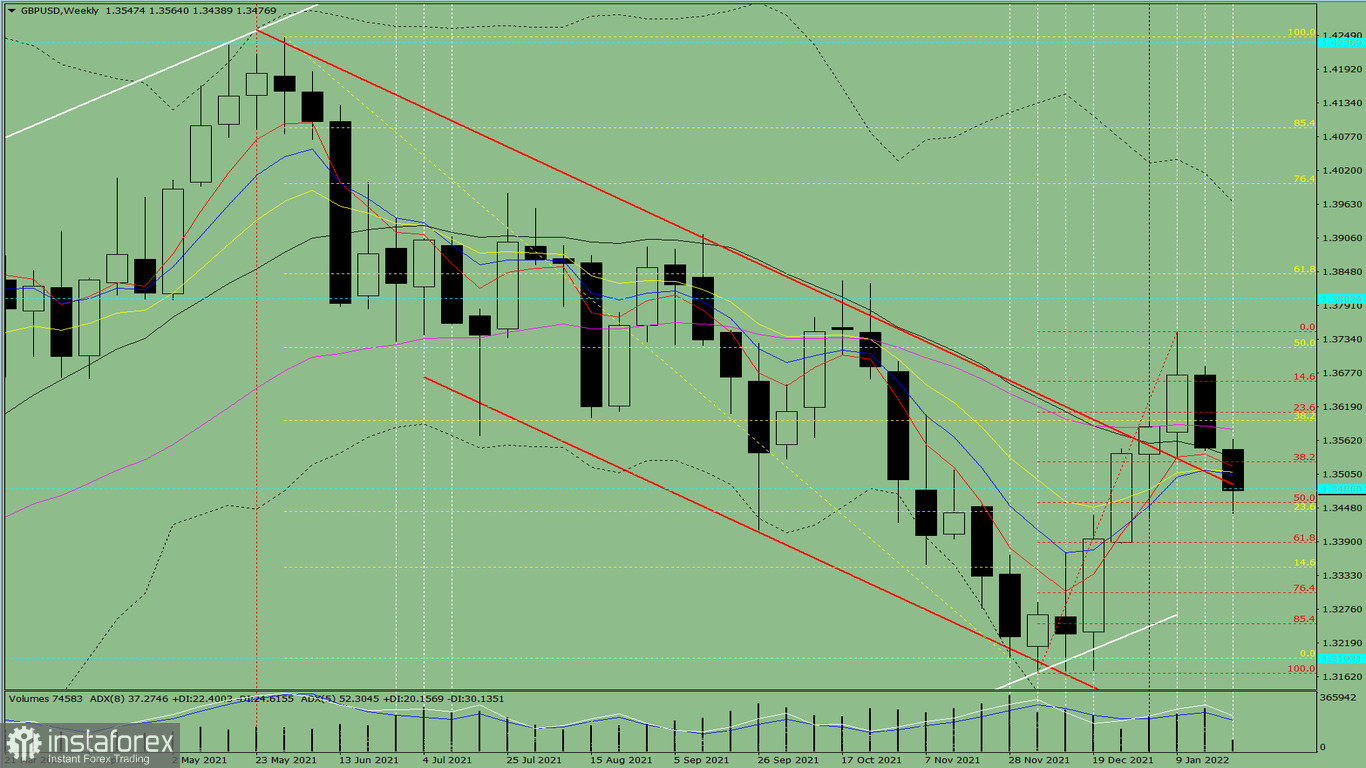
Fig 1 (weekly chart)
Comprehensive analysis:
A downward movement can be concluded based on a comprehensive analysis.
The overall result of the candlestick calculation based on the weekly chart: the price will most likely move in a downward trend without the first upper shadow (Monday - down) and with the second lower shadow (Friday - up) in the weekly black candle.
The price will decline from the level of 1.3549 (closing of the last weekly candle) to the target of 1.3457 – the pullback level of 50% (red dotted line) this week. Once this level is reached, it may begin rising to the target of 1.3596 – the pullback level of 38.2% (yellow dotted line), from which it is possible to continue the upward trend.
Alternatively, the price from the level of 1.3549 (closing of the last weekly candle) may plunge to the target of 1.3389 – the pullback level of 61.8% (red dotted line), and then start moving up to the target of 1.3480 – the historical resistance line (blue dotted line) after reaching this level.
Díky analytickým přehledům společnosti InstaForex získáte plné povědomi o tržních trendech! Jako zákazníkovi společnosti InstaForex je Vám k dispozici velký počet bezplatných služeb umožňujících efektivní obchodování.

