 Zůstat
Obchodní podmínky
Nástroje


Trend analysis (Fig. 1)
The price from the level of 1.1239 (closing of yesterday's daily candle) will make an attempt to continue to decline today in order to test the level of 1.1202 – lower border of the Bollinger line indicator (black dotted line). After this line is reached, the price may start rising to the target of 1.1253 – the pullback level of 14.6% (yellow dotted line).
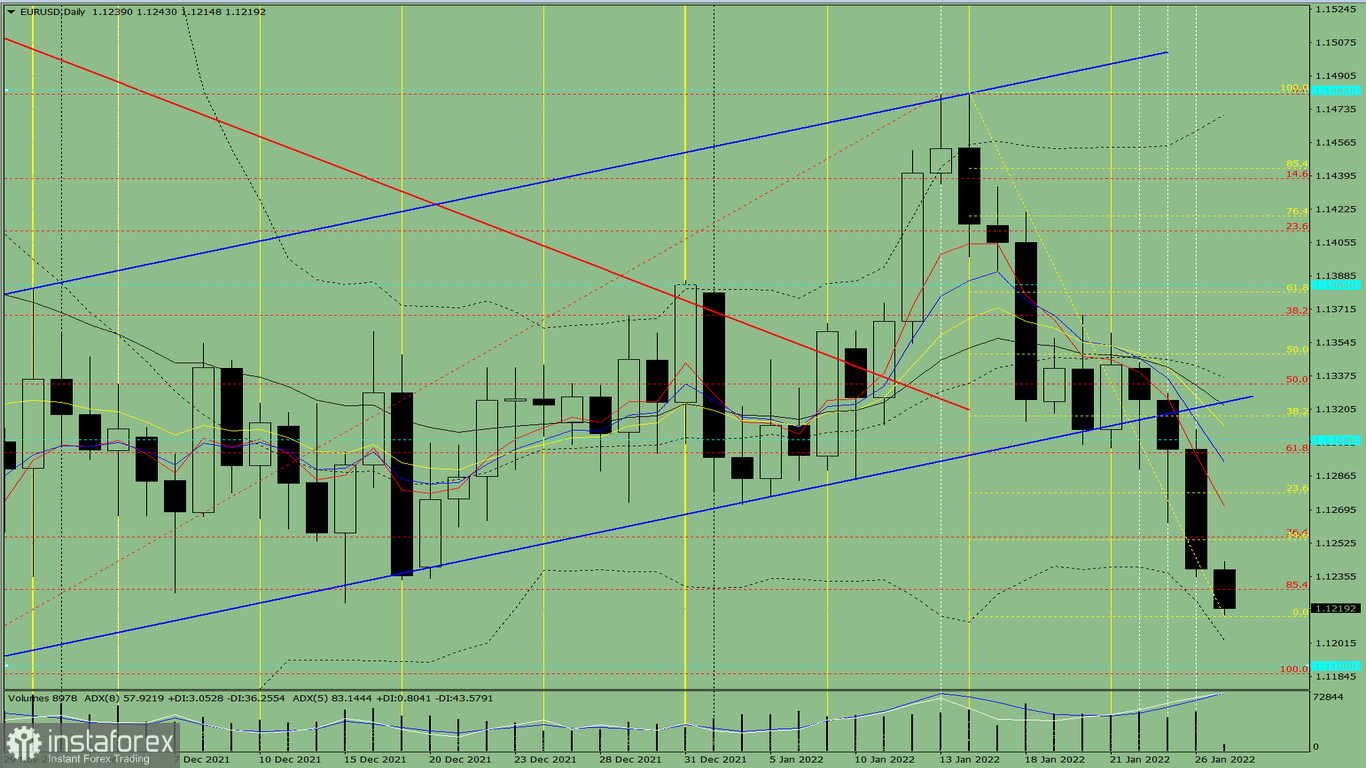
Fig 1 (daily chart)
Comprehensive analysis:
General conclusion:
Today, the price from the level of 1.1239 (closing of yesterday's daily candle) will try to further fall to be able to test the level of 1.1202 – lower border of the Bollinger line indicator (black dotted line). After reaching it, the price may begin its growth to the target of 1.1253 – the pullback level of 14.6% (yellow dotted line).
Alternatively, the price from the level of 1.1239 (closing of yesterday's daily candle) will attempt to resume its decline in order to test the lower fractal of 1.1186 (red dotted line) and then rise again to the target 1.1254 – the pullback level of 14.6% (yellow dotted line).
Díky analytickým přehledům společnosti InstaForex získáte plné povědomi o tržních trendech! Jako zákazníkovi společnosti InstaForex je Vám k dispozici velký počet bezplatných služeb umožňujících efektivní obchodování.

