 Zůstat
Obchodní podmínky
Nástroje


Trend analysis
The price from the level of 1.1235 (closing of the January monthly candlestick) will most likely rise to the target of 1.1302 – the historical resistance level (blue dotted line) this month. After this level is reached, it may further increase to the target of 1.1409 – the pullback level of 23.6% (blue dotted line) and continue the upward movement to the target of 1.1590 – the pullback level of 38.2% (blue dotted line).
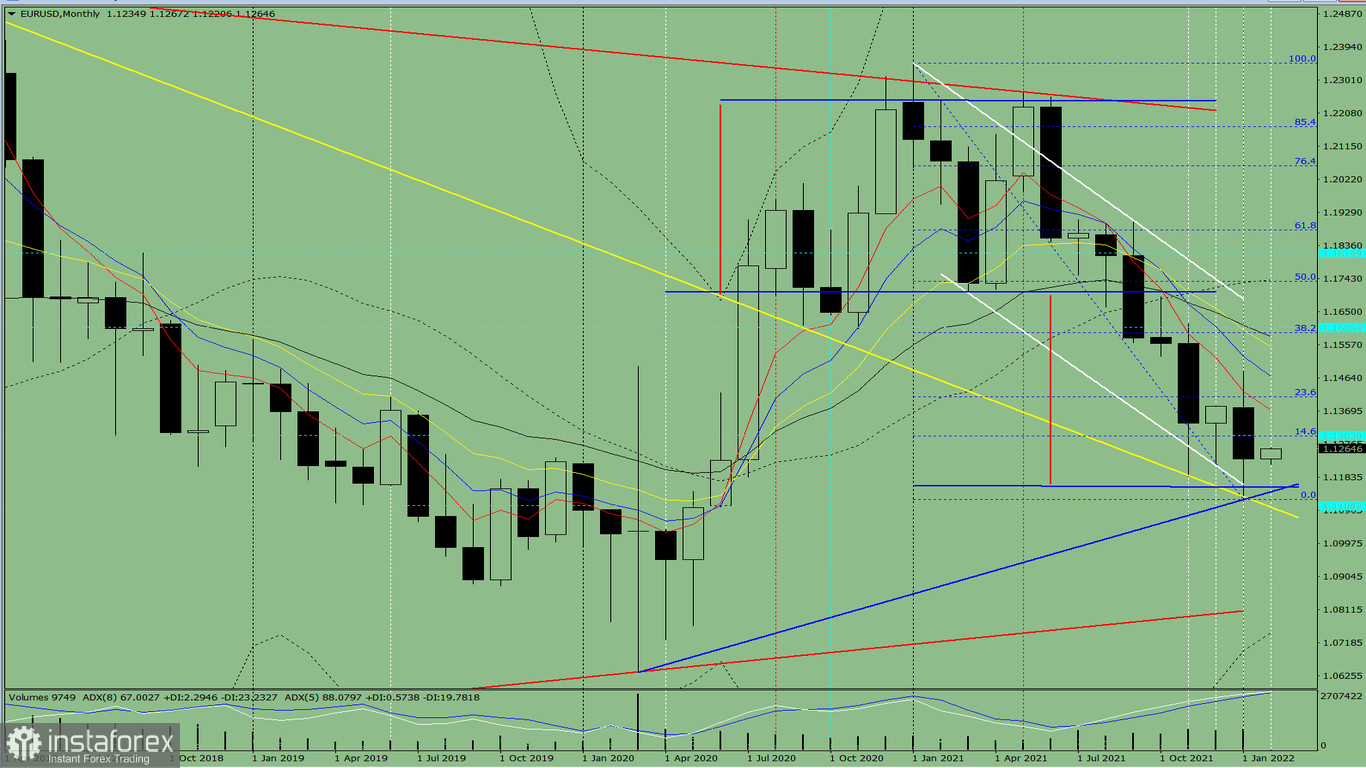
Fig. 1 (monthly chart)
Indicator analysis:
An upward movement can be concluded based on a comprehensive analysis.
The overall result of the candlestick calculation based on the monthly chart: the price will most likely move in an upward trend, both without the first lower shadow (the first week of the month is white) and without the second upper shadow (the last week is white) in the monthly white candlestick.
This month, the price from the level of 1.1235 (closing of the January monthly candlestick) will increase to the target of 1.1302 – the historical resistance level (blue dotted line). After reaching it, it may continue its growth to the target of 1.1409 – the pullback level of 23.6% (blue dotted line), and then further rise to the target of 1.1590 – the pullback level of 38.2% (blue dotted line).
Alternatively, the price from the level of 1.1235 (closing of the January monthly candlestick) may decline to the target of 1.1094 – the support line (thick yellow line). If this line is tested, it may now rise to the target of 1.1302 – the pullback level of 14.6% (blue dotted line) and continue moving up.
Díky analytickým přehledům společnosti InstaForex získáte plné povědomi o tržních trendech! Jako zákazníkovi společnosti InstaForex je Vám k dispozici velký počet bezplatných služeb umožňujících efektivní obchodování.


