 Zůstat
Obchodní podmínky
Nástroje


Details of the economic calendar from May 16
Monday was traditionally accompanied by a blank macroeconomic calendar. Important statistics in Europe, the UK, and the United States were not released.
Analysis of trading charts from May 16
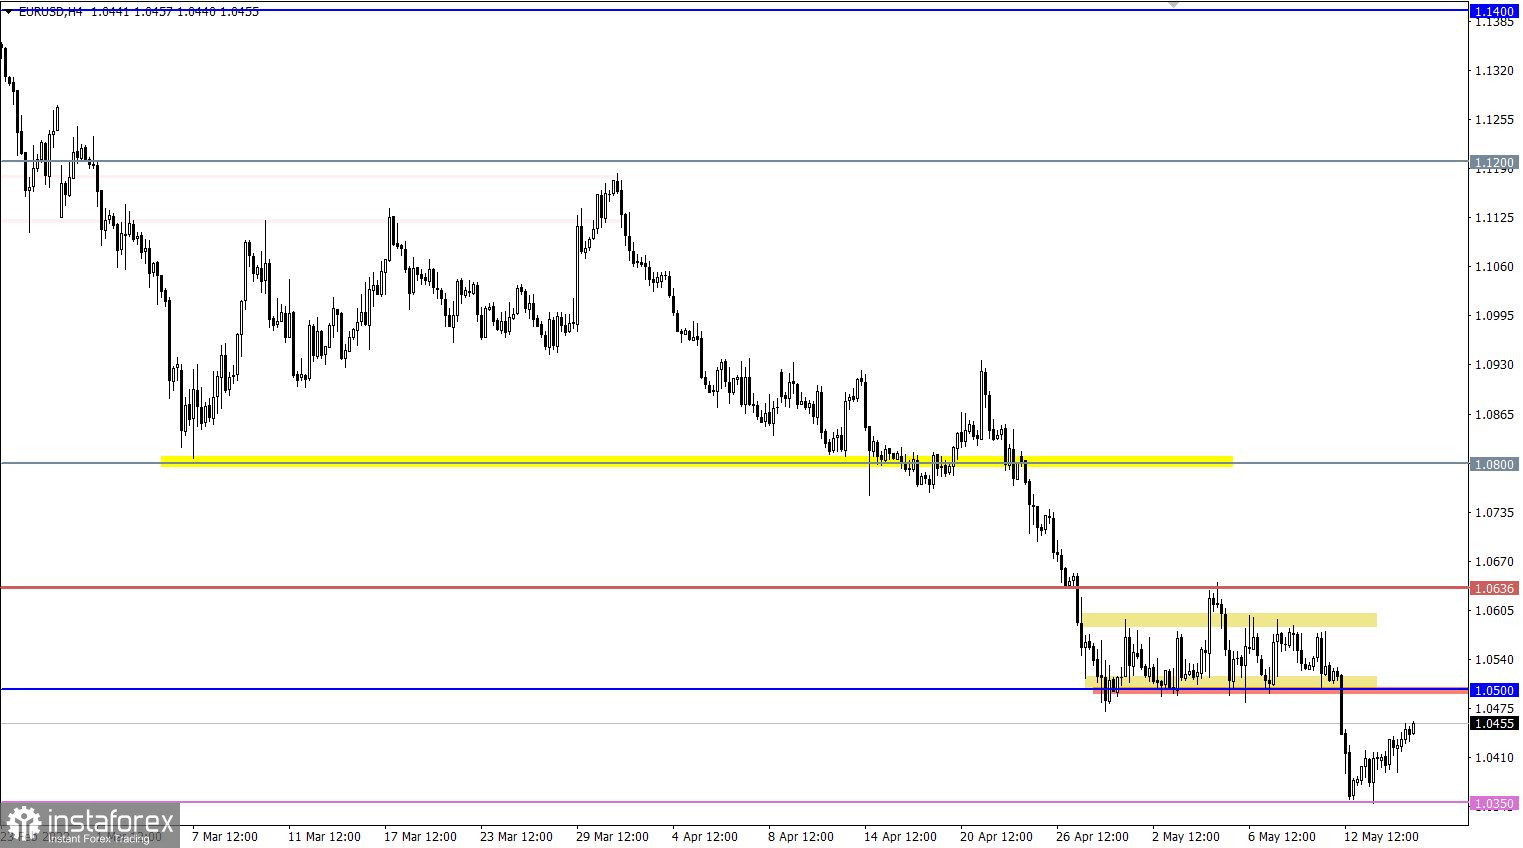
The EURUSD currency pair resumed its upward move after a short stop. This led to the formation of a full-size correction in the market.
On the trading chart of the daily period, the downward trend signal remains, despite the current corrective move.
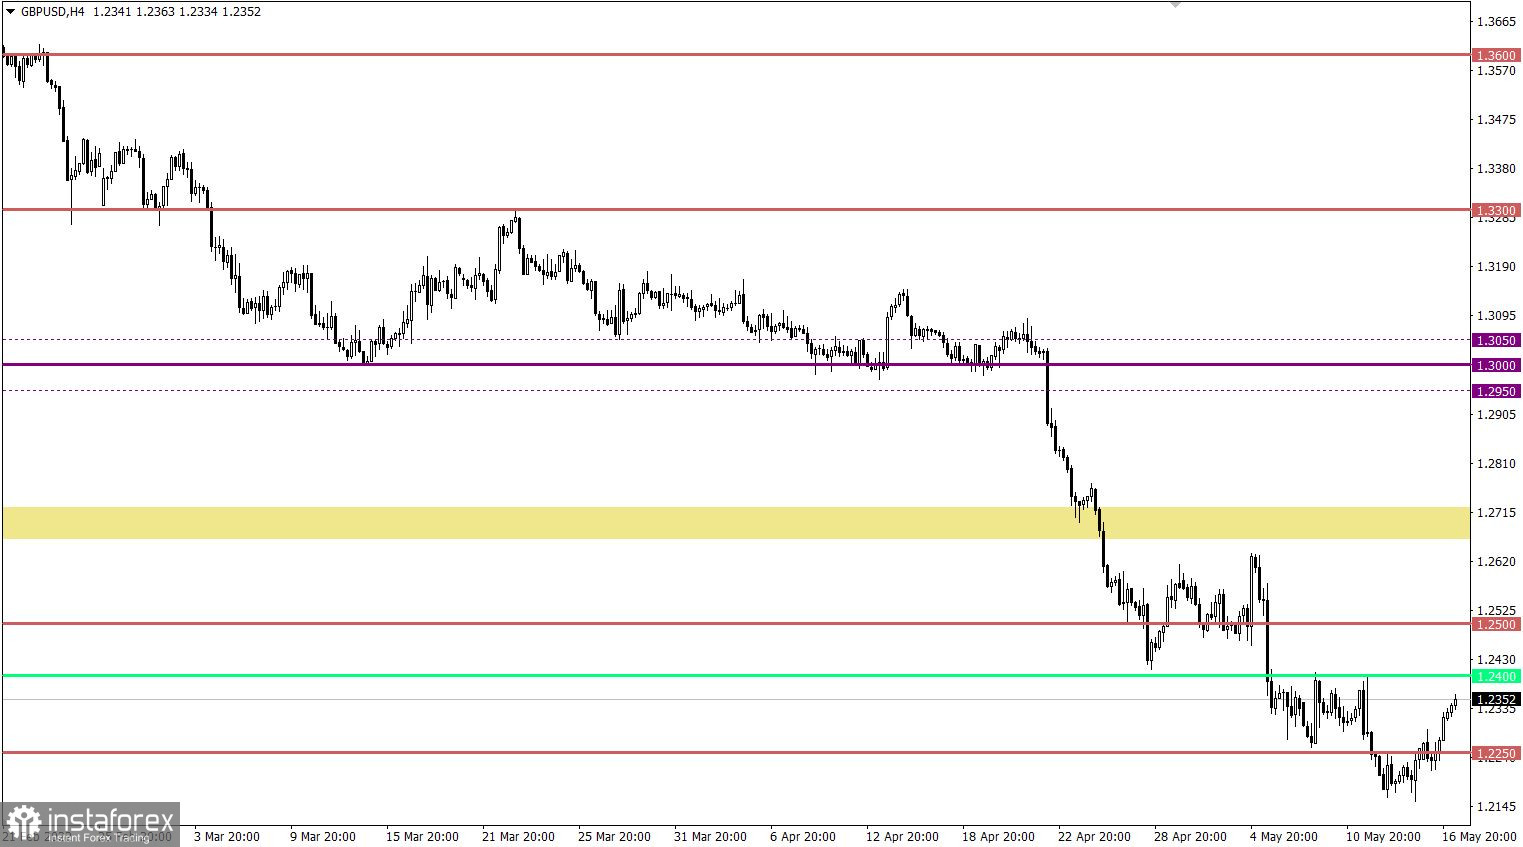
The GBPUSD currency pair is in the process of correction from the variable pivot point 1.2155. As a result of this movement, the quote managed to partially restore the pound sterling exchange rate, removing the oversold status from it.

Economic calendar for May 17
Today, with the opening of the European session, data on the labor market in the UK were published, which came out better than forecasts. The unemployment rate decreased from 3.8% to 3.7%, while employment in the country increased by 83,000. The change in the number of applications for unemployment benefits in April decreased by 56,900.
The indicators on the UK labor market are very good, which can support the British currency.
In Europe, the publication of the second estimate of GDP for the first quarter is expected, which should only confirm the first estimate. Thus, if the indicators coincide, there will be no reaction in the market.
During the American trading session, data on retail sales in the United States will be published, which may revive the market. Moreover, their growth rates may slow down from 6.9% to 4.2%, which is considered bad. This may lead to a weakening of dollar positions.
Also, the US will publish data on industrial production, the pace of which may slow down from 5.5% to 2.0%, which will increase the negative for the dollar.
Time targeting
EU GDP - 09:00 UTC
US Retail Sales - 12:30 UTC
Industrial production in the USA - 13:15 UTC
Trading plan for EUR/USD on May 17
In this situation, the corrective move may well return the quote to the level of 1.0500, which will play the role of resistance in the market. In this case, the sellers will have a second chance to break through the local bottom of 2016 at 1.0325.
Holding the price above the level of 1.0500 in the daily period can lead to stagnation in the 1.0500/1.0600 range.
Trading plan for GBP/USD on May 17
The corrective move is still relevant on the market, it may well return the quote to the area of 1.2400/1.2420. At the same time, without violating the integrity of the downward trend.
What is reflected in the trading charts?
A candlestick chart view is graphical rectangles of white and black light, with sticks on top and bottom. When analyzing each candle in detail, you will see its characteristics of a relative period: the opening price, closing price, and maximum and minimum prices.
Horizontal levels are price coordinates, relative to which a stop or a price reversal may occur. These levels are called support and resistance in the market.
Circles and rectangles are highlighted examples where the price of the story unfolded. This color selection indicates horizontal lines that may put pressure on the quote in the future.
The up/down arrows are the reference points of the possible price direction in the future.
Díky analytickým přehledům společnosti InstaForex získáte plné povědomi o tržních trendech! Jako zákazníkovi společnosti InstaForex je Vám k dispozici velký počet bezplatných služeb umožňujících efektivní obchodování.


