 Zůstat
Obchodní podmínky
Nástroje


The GBP/USD pair fell on Wednesday. The decline was less strong than the growth a day earlier. However, it was logical. Not from the point of view of the logic of working out the report on British inflation, but from the perspective of the strength of the movement in one direction immediately after the release of an important report. We cannot conclude that the fall of the British currency by 130 points is logical, based on increased inflation to 9%. However, this is in any case the reaction of the market. Thus, at the moment the pair has settled below the Senkou Span B line and is rushing at full steam to the critical line. If this line misses the price below itself, then the chances of a resumption of the downward trend will greatly increase and will aim for 70-80%. The situation with the pound is almost identical to the situation with the euro. For both European currencies, the Kijun-sen line is now of paramount importance. In both cases, traders could simply take a "run-up" before a new, more powerful fall. Both the euro and the pound do not currently have sufficient support from the foundation or macroeconomics, so a fall is really possible, despite the "technical factor", which requires a strong correction.
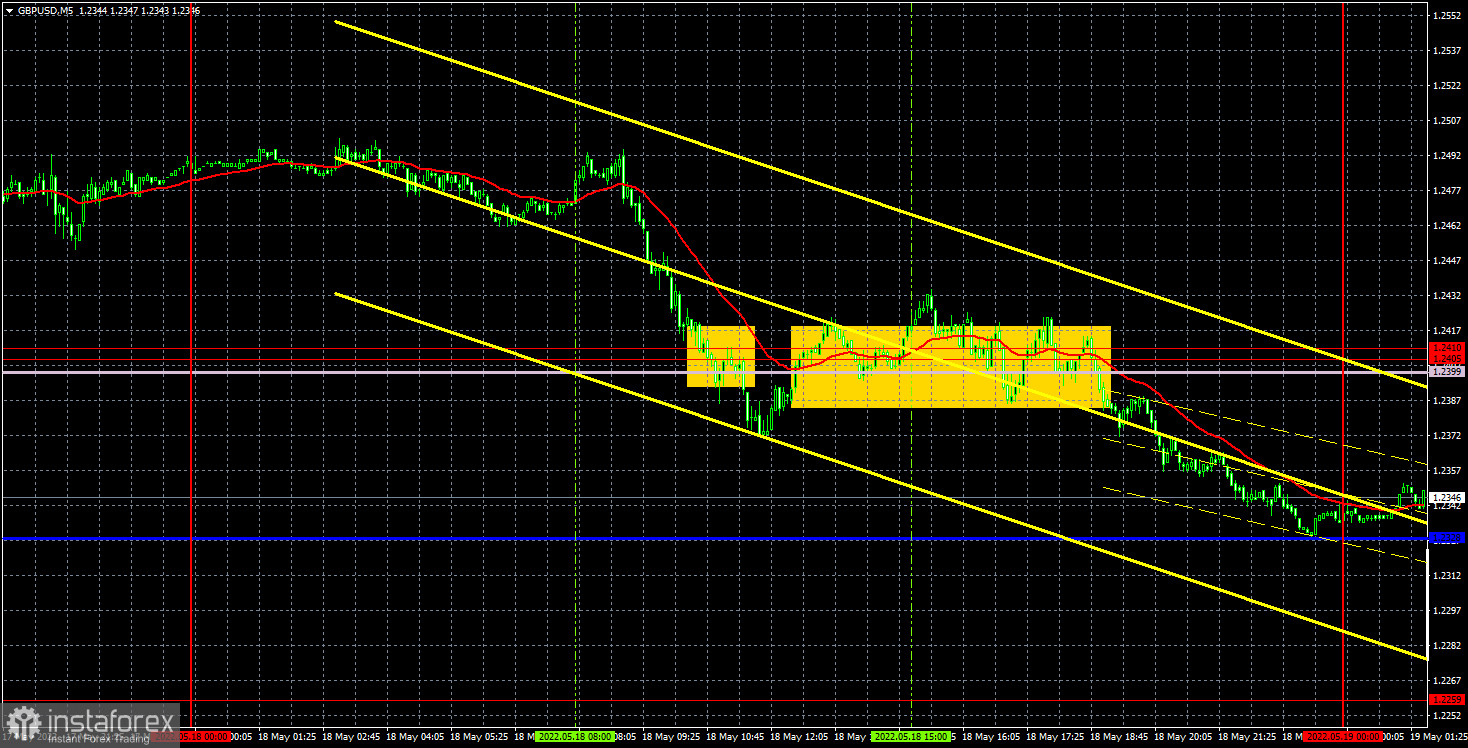
In regards to trading signals, things were bad on Wednesday. Despite the fact that most of the day the pair was in a trend movement, all trading signals were formed when the pair took a break. The first sell signal, when the price broke through the levels of 1.2410, 1.2405 and the Senkou Span B line, could be worked out. With great difficulty, the price went down another 20 points and ended the fall after the British inflation report was released. A Stop Loss should have been placed on the trade to avoid a loss. But then the pair returned to the aforementioned levels and lines, and started trading exactly along it, forming false signals. Traders could work out another buy signal, which, most likely, brought a small loss, but all subsequent signals should be ignored.
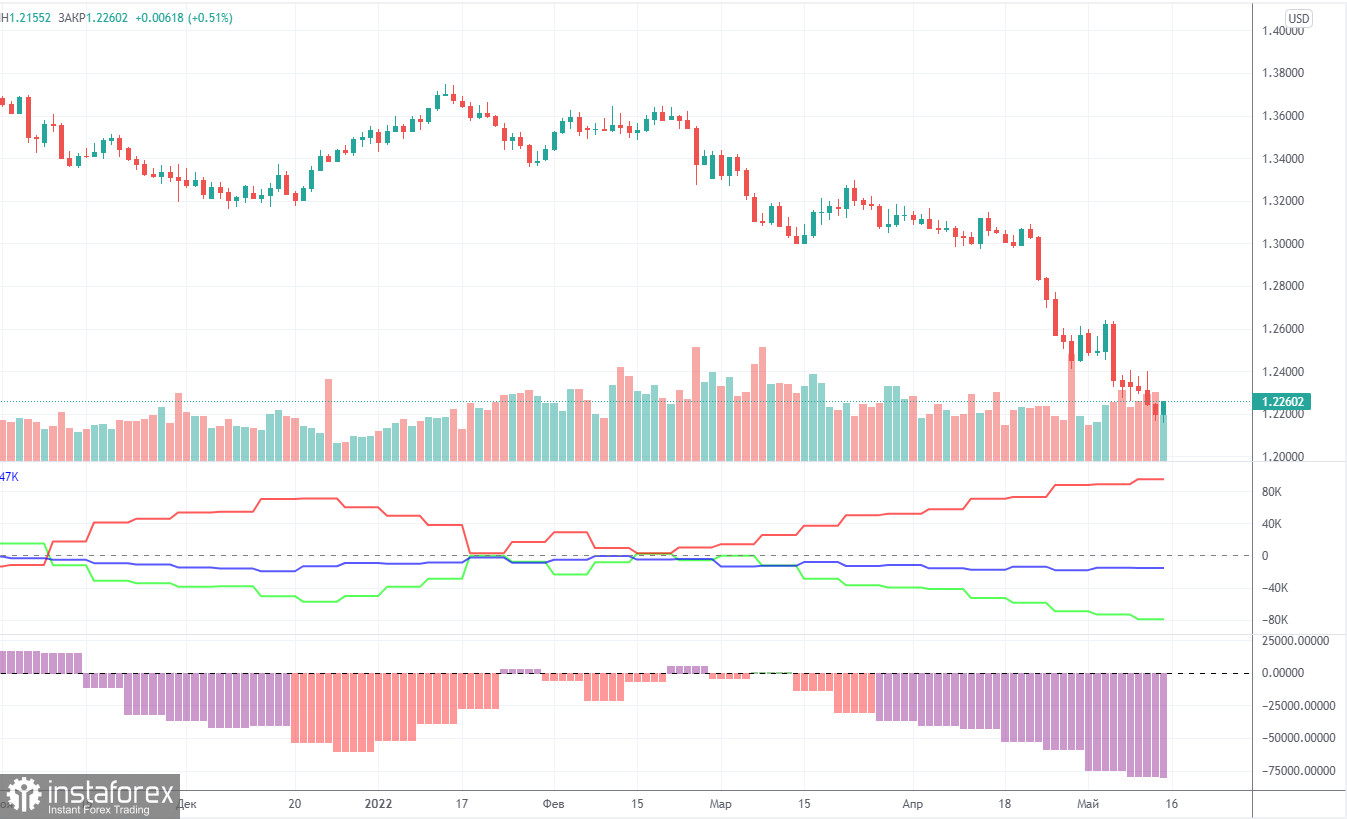
The latest Commitment of Traders (COT) report on the British pound has witnessed a new increase in bearish sentiment among professional traders. During the week, the non-commercial group closed 4,000 long positions and opened 1,700 short positions. Thus, the net position of non-commercial traders decreased by another 5,700. The net position has been falling for three months already, which is perfectly visualized by the green line of the first indicator in the chart above. Or the histogram of the second indicator. The non-commercial group has already opened a total of 109,000 shorts and only 29,000 longs. Thus, the difference between these numbers is already fourfold. This means that the mood among professional traders is now "pronounced bearish" and this is another factor that speaks in favor of the continuation of the fall of the British currency. Note that in the case of the pound, the data from the COT reports very accurately reflects what is happening in the market. Traders are "strongly bearish" and the pound has been falling against the US dollar for a very long time. We do not yet see concrete signals for the end of the downward trend, however, usually a strong divergence of the red and green lines of the first indicator signals the imminent end of the trend and the beginning of another. Therefore, the conclusion is that an upward trend may begin in the near future, but it is dangerous to try to catch its beginning at the lowest point. The pound may well fall another 200-400 points.
Overview of the EUR/USD pair. May 19. Sweden and Finland have applied to join NATO. Possible conflict in the Baltics.
Overview of the GBP/USD pair. May 19. Highest inflation in the UK, is it good or bad for the British pound?
Forecast and trading signals for GBP/USD on May 19. Detailed analysis of the movement of the pair and trading transactions.
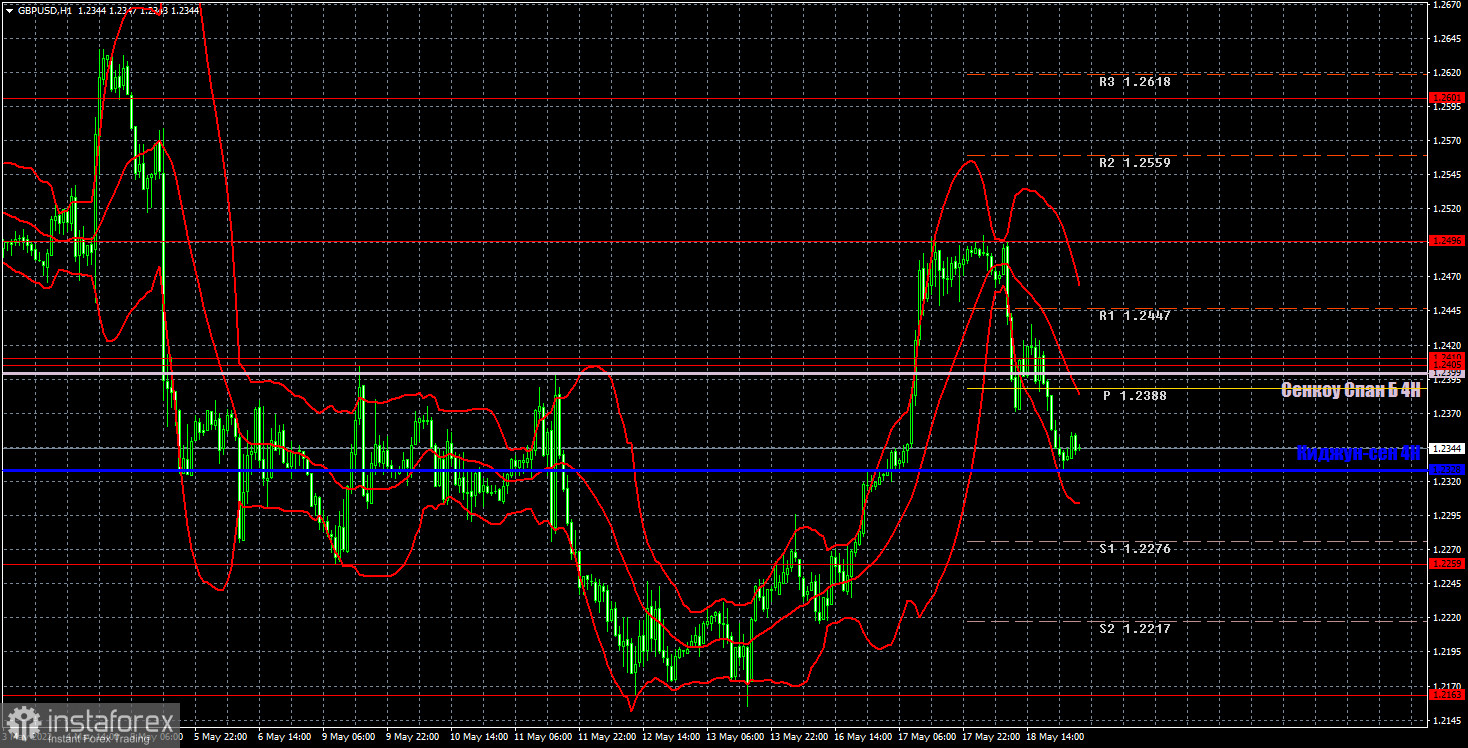
It is clearly seen on the hourly timeframe that the pound quickly took off and is now also falling rapidly. If the critical line is overcome, the pair will head for the levels of 1.2259 and 1.2163. Traders worked out macroeconomic statistics quite well on Tuesday and Wednesday, but there will be no such important reports on Thursday and Friday. For May 19, we highlight the following important levels: 1.2073, 1.2163, 1.2259, 1.2405-1.2410, 1.2496. Senkou Span B (1.2399) and Kijun-sen (1.2328) lines can also be sources of signals. Signals can be "rebounds" and "breakthrough" of these levels and lines. The Stop Loss level is recommended to be set to breakeven when the price passes in the right direction by 20 points. Ichimoku indicator lines can move during the day, which should be taken into account when determining trading signals. The chart also contains support and resistance levels that can be used to take profits on trades. There are no major events or releases scheduled for Thursday in the UK, and only minor data in the US. However, high volatility and strong movements may persist in the pound.
Support and Resistance Levels are the levels that serve as targets when buying or selling the pair. You can place Take Profit near these levels.
Kijun-sen and Senkou Span B lines are lines of the Ichimoku indicator transferred to the hourly timeframe from the 4-hour one.
Support and resistance areas are areas from which the price has repeatedly rebounded off.
Yellow lines are trend lines, trend channels and any other technical patterns.
Indicator 1 on the COT charts is the size of the net position of each category of traders.
Indicator 2 on the COT charts is the size of the net position for the non-commercial group.
Díky analytickým přehledům společnosti InstaForex získáte plné povědomi o tržních trendech! Jako zákazníkovi společnosti InstaForex je Vám k dispozici velký počet bezplatných služeb umožňujících efektivní obchodování.

