 Zůstat
Obchodní podmínky
Nástroje


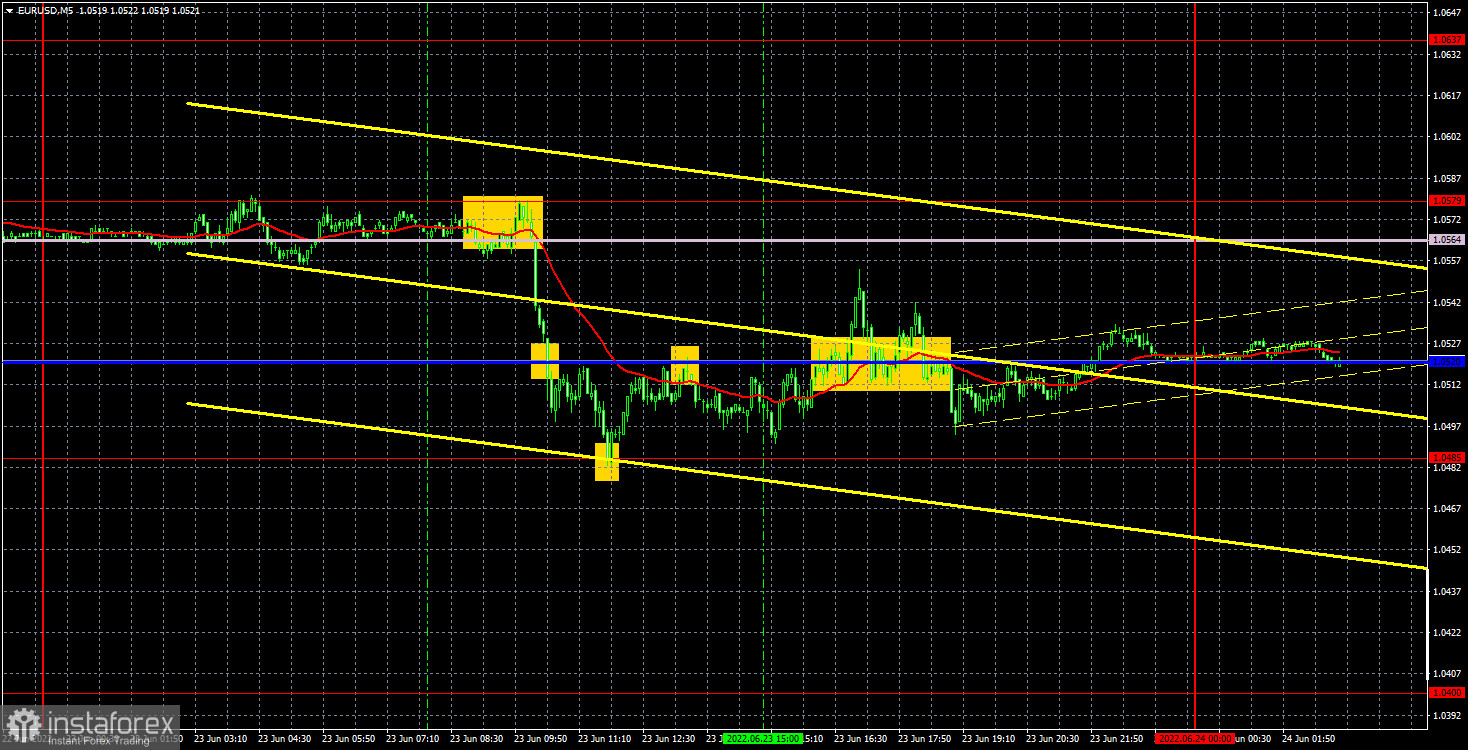
On Thursday, the EUR/USD pair traded in the same direction as three days before. At the beginning of the European trading session, the pair fell by almost 100 points in just an hour, and this collapse is difficult to link to any macroeconomic or fundamental event. Formally, at about the same time, a report on business activity in the European Union was published, but in fact, when it came out and turned out to be very weak, the pair had already fallen by 70-80 points. Thus, it is very difficult to call a "reaction to an event" a reaction that occurred before the event. Further, the pair did not show anything interesting at all, although data on business activity in the US were published in the afternoon, which also turned out to be very weak. But quotes still failed to get out of the horizontal channel at 1.0485-1.0579.
Thursday's trading signals were very difficult, but it was possible to make money. The first sell signal was formed in the area of 1.0564-1.0579 and after it the pair managed to fall to the extreme level of 1.0485. Thus, traders made a profit of about 45 points on the very first transaction. Then it was necessary to open long positions on the signal from the level of 1.0485. The price reached the critical line and rebounded from it: we close longs, open shorts, profit is another 10 points. The price failed to reach the level of 1.0485 again, so the third deal was closed by Stop Loss at breakeven (15 points were passed down). The signal or signals that formed during the US trading session should not have been worked out, since two false signals had already formed near the critical line by that time.
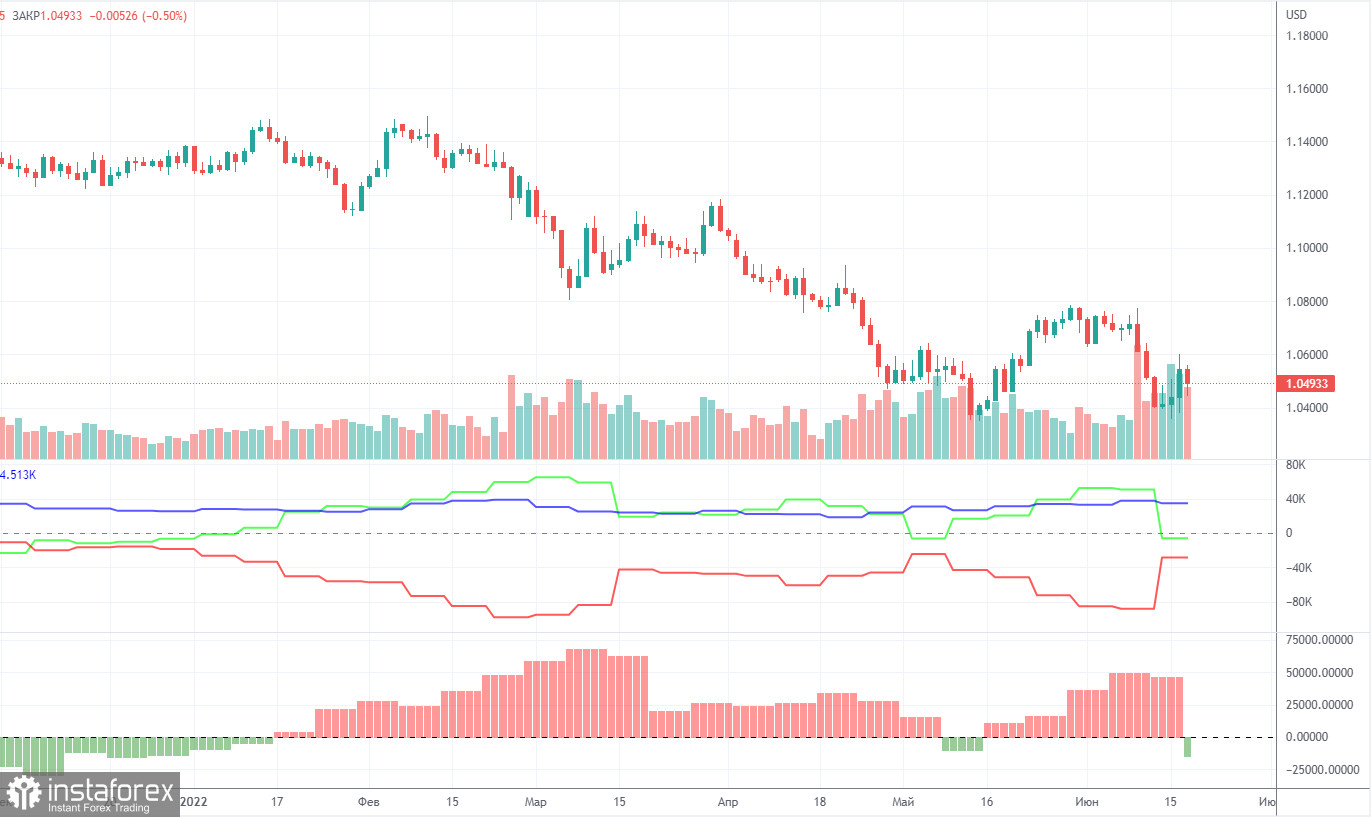
The latest Commitment of Traders (COT) reports on the euro raised a lot of questions. Recall that in the past few months, they showed a blatant bullish mood of professional players, but the euro fell all the time. At this time, the situation is beginning to change, and again, not in favor of the euro. If earlier the mood was bullish, but the euro was falling, now the mood has become bearish... During the reporting week, the number of long positions decreased by 23,200, while the number of shorts in the non-commercial group increased by 33,300. Thus, the net position fell by 56,500 contracts in just a week. From our point of view, this fact very eloquently indicates that now even major players do not believe in the euro. The number of longs is now lower than the number of shorts for non-commercial traders by 6,000. Therefore, we can well expect that now not only the demand for the US dollar will remain strong, but also the demand for the euro will decline. Again, this may lead to an even greater fall in the euro. In principle, over the past few months or even more, the euro has not been able to show even a strong correction, not to mention something more. Its highest upward movement was about 400 points. All fundamental, geopolitical factors remain in favor of the US dollar.
Overview of the EUR/USD pair. June 24. The "swing" continues, Powell was not surprised.
Overview of the GBP/USD pair. June 24. Where is the pound? Has anyone seen the pound?
Forecast and trading signals for GBP/USD on June 24. Detailed analysis of the movement of the pair and trading transactions.
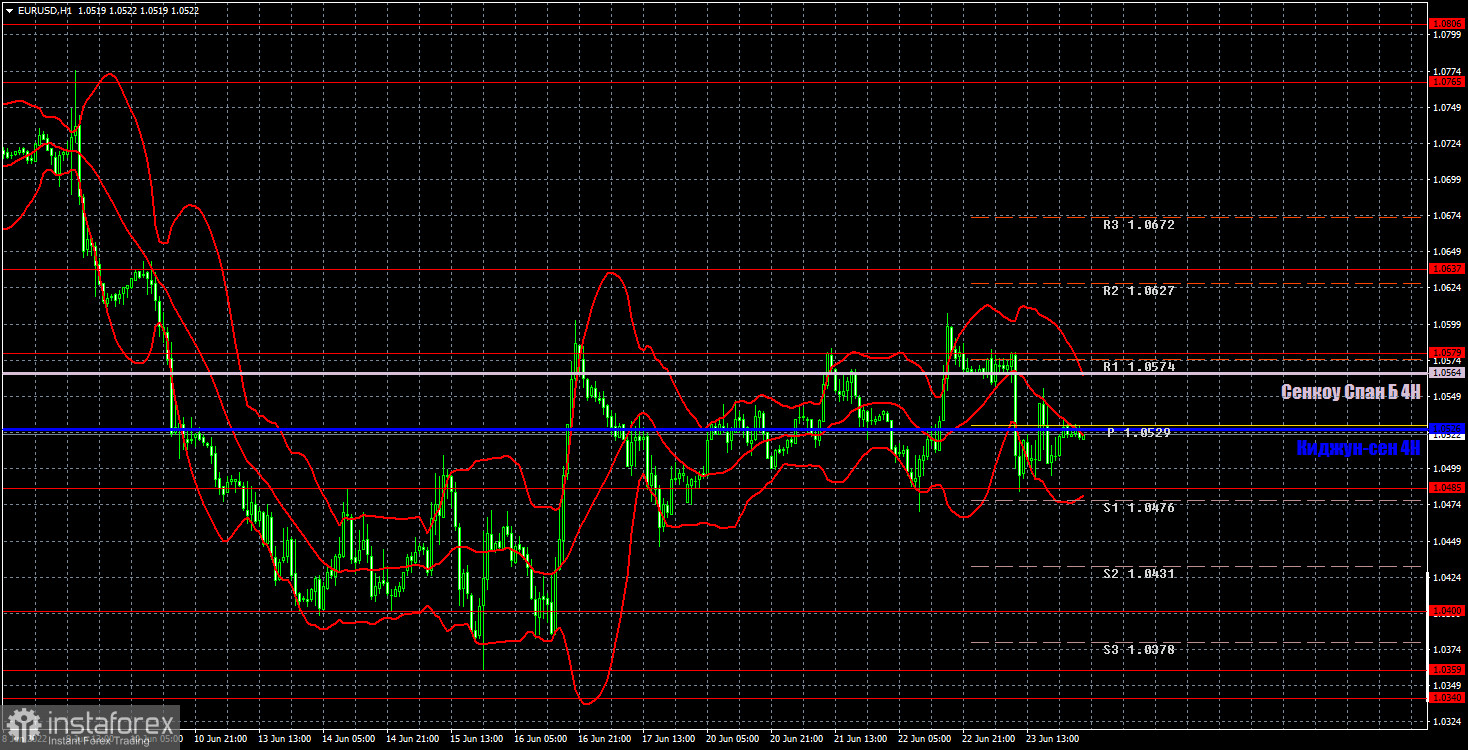
The pair finally went into a flat movement on the hourly timeframe. So now it can be traded either on a rebound from the channel boundaries, or wait for the end of the flat and the resumption of any trend. This week can be considered a week of consolidation, but now it's good if the pair does not spend the next few weeks in a flat. We highlight the following levels for trading on Friday - 1.0340-1.0359, 1.0400, 1.0485, 1.0579, 1.0637, as well as Senkou Span B (1.0564) and Kijun-sen (1 .0520). Ichimoku indicator lines can move during the day, which should be taken into account when determining trading signals. There are also secondary support and resistance levels, but no signals are formed near them. Signals can be "rebounds" and "breakthrough" extreme levels and lines. Do not forget about placing a Stop Loss order at breakeven if the price has gone in the right direction for 15 points. This will protect you against possible losses if the signal turns out to be false. No major events are scheduled for June 24 in Europe, and only the consumer sentiment indicator from the University of Michigan will be released in the US. Not the most important report, but the market is "thin" now, so the reaction to it may follow. Especially given the fact that another strong drop in sentiment is expected.
Support and Resistance Levels are the levels that serve as targets when buying or selling the pair. You can place Take Profit near these levels.
Kijun-sen and Senkou Span B lines are lines of the Ichimoku indicator transferred to the hourly timeframe from the 4-hour one.
Support and resistance areas are areas from which the price has repeatedly rebounded off.
Yellow lines are trend lines, trend channels and any other technical patterns.
Indicator 1 on the COT charts is the size of the net position of each category of traders.
Indicator 2 on the COT charts is the size of the net position for the non-commercial group.
Díky analytickým přehledům společnosti InstaForex získáte plné povědomi o tržních trendech! Jako zákazníkovi společnosti InstaForex je Vám k dispozici velký počet bezplatných služeb umožňujících efektivní obchodování.

