 Zůstat
Obchodní podmínky
Nástroje


The EUR/USD pair fell from the level of 1.0640 to bottom at 1.0595 yesterday. Today, the EUR/USD pair has faced strong support at the level of 1.0574. So, the strong support has been already faced at the level of 1.0574 and the pair is likely to try to approach it in order to test it again and form a double bottom. Hence, the EUR/USD pair is continuing to trade in a bullish trend from the new support level of 1.0574; to form a bullish channel.
According to the previous events, we expect the pair to move between 1.0574 and 1.0640. Also, it should be noted major resistance is seen at 1.0640, while immediate resistance is found at 1.0619. Then, we may anticipate potential testing of 1.0619 to take place soon. Moreover, if the pair succeeds in passing through the level of 1.0619, the market will indicate a bullish opportunity above the level of 1.0619. A breakout of that target will move the pair further upwards to 1.0640. Buy orders are recommended above the area of 1.0574 with the first target at the level of 1.0640; and continue towards 1.0667.
At the same chart, the GBP/USD pair is still below the MA 100 H1 line - the first resistance of 1.0701. Based on the foregoing, it is probably worth sticking to the north direction in trading, and as long as the GBP/USD pair remains below MA 100 H1, it may be necessary to look for entry points to buy at the end of the correction. The EUR/USD pair tests 1.0701 level and still below it, and the contradiction between the technical indicators still valid, to continue with our neutrality until the price confirms its situation according to the mentioned level followed by detecting its next destination clearly. To review the expected targets for the upcoming period, please check our morning report. Intraday bias in EUR/USD pair stays on the downside, as fall from 1.0701 is targeting 100 day EMA (now at 1.0650).
Firm break there will target 38.2% retracement of 1.0637 to 1.0598. The expected trading range for today is between 1.0598 support and 1.0701 resistance. The EUR/USD pair has extended its daily slide and declined below 1.0701. With the US Dollar staying resilient against its rivals following the better-than-forecast data, the pair is having a difficult time staging a rebound in the early American session. The expected trend for today: Bearish market. Targets : 1.0637 and 1.0598. On the upside, break of 1.0701 minor resistance will turn bias back to the upside for retesting 1.0745 instead. However, if the EUR/USD pair is able to break out the daily resistance at 1.0745, the market will rise further to 1.0804 to approach resistance 2 today.
The trend of EUR/USD pair movement was controversial as it took place in a narrow sideways channel, the market showed signs of instability.
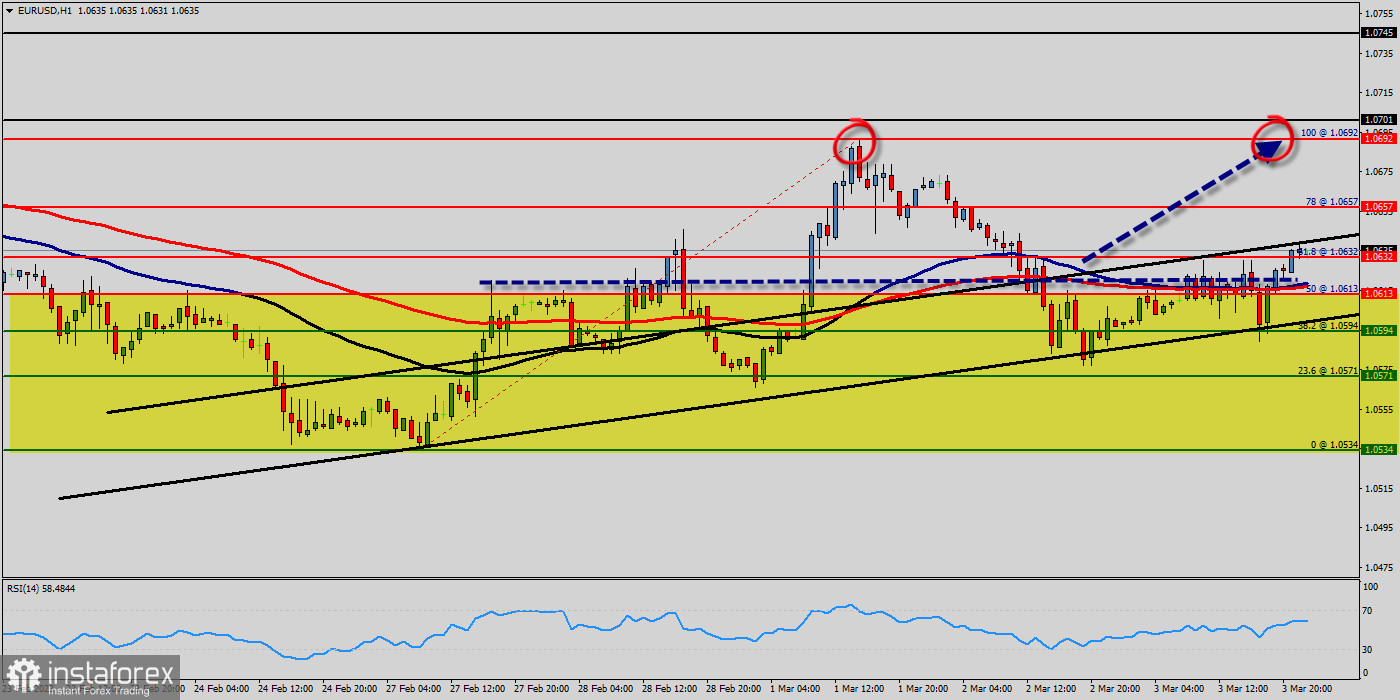
Amid the previous events, the price is still moving between the levels of 1.0632 and 1.0571. Also, the daily resistance and support are seen at the levels of 1.0632 and 1.0571 respectively. Therefore, it is recommended to be cautious while placing orders in this area. So, we need to wait until the sideways channel has completed.
The market moved from its bottom at 1.0571 and continued to rise towards the top of 1.0600.
Today, in the one-hour chart, the current rise will remain within a framework of correction. The Relative Strength Index (RSI) is considered oversold because it is above 50. The RSI is still signaling that the trend is upward as it is still strong below the moving average (100). This suggests the pair will probably go down in coming hours.
Since there is nothing new in this market, it is not bullish yet. Sell deals are recommended below the level of 1.0613 with the first target at 1.0571. If the trend breaks the support level of 1.0571, the pair is likely to move downwards continuing the development of a bearish trend to the level 1.0534 in order to test the daily support 2 (horizontal green line).
Díky analytickým přehledům společnosti InstaForex získáte plné povědomi o tržních trendech! Jako zákazníkovi společnosti InstaForex je Vám k dispozici velký počet bezplatných služeb umožňujících efektivní obchodování.


