 Zůstat
Obchodní podmínky
Nástroje


The final data on UK GDP for the first quarter fully coincided with the preliminary estimate, which means that they have already been taken into account in the quotes. The slowdown in economic growth from 5.5% to 3.5%.
During the American trading session, weekly data on jobless claims in the United States were published, which saw a decrease in volume.
Statistics details:
The volume of continuing claims for benefits decreased from 1.331 million to 1.328 million.
The volume of initial claims for benefits decreased from 233,000 to 231,000.
Despite the fact that the volume of applications decreased, the data still turned out to be worse than expected. First of all, it is worth noting the revision of previous indicators in favor of growth, and the current data fell significantly less than the forecast. The result disappointed investors, which led to a local sell-off of the US dollar.
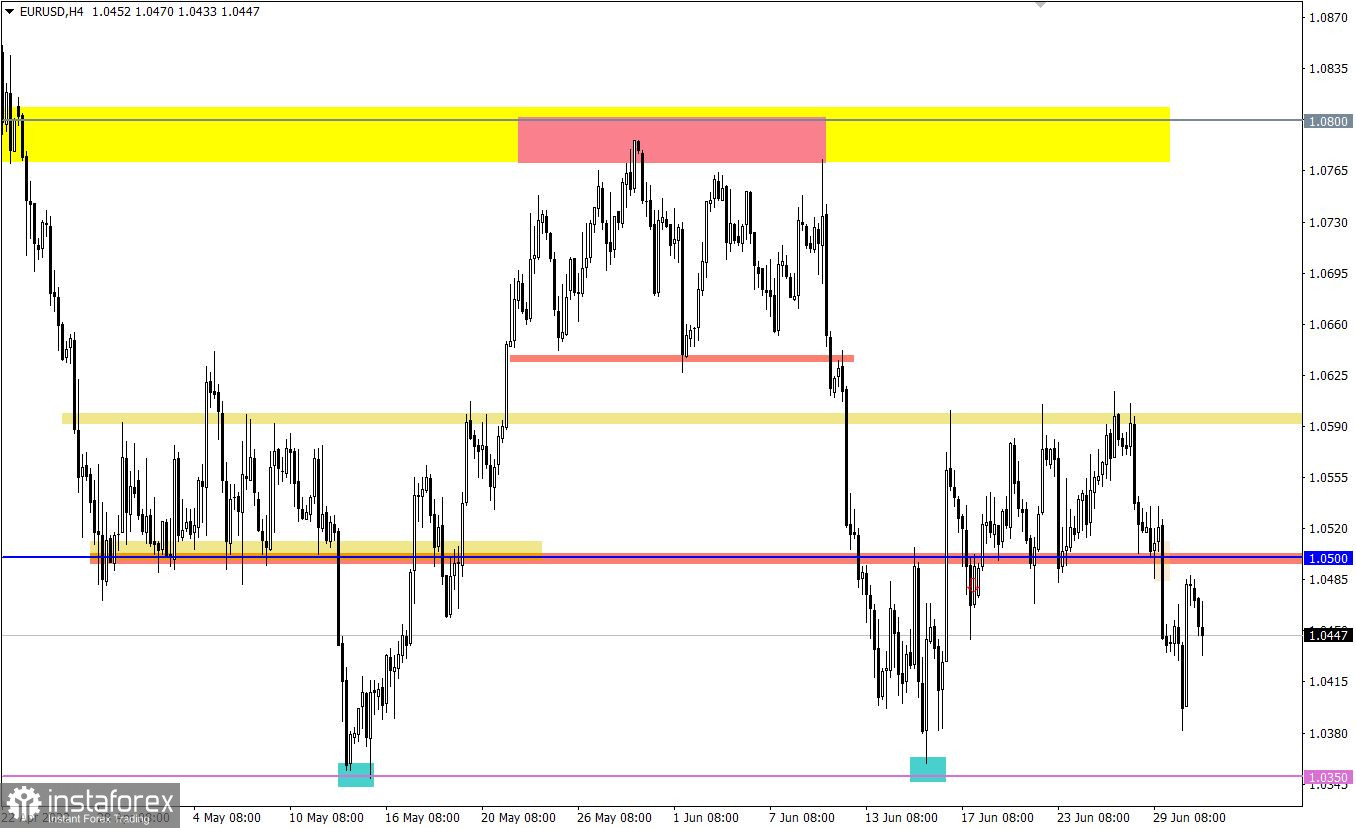
During the intensive downward movement, the EURUSD currency pair has come close to the bottom of the downward trend, where there was a reduction in the volume of short positions as a result of a technical pullback.
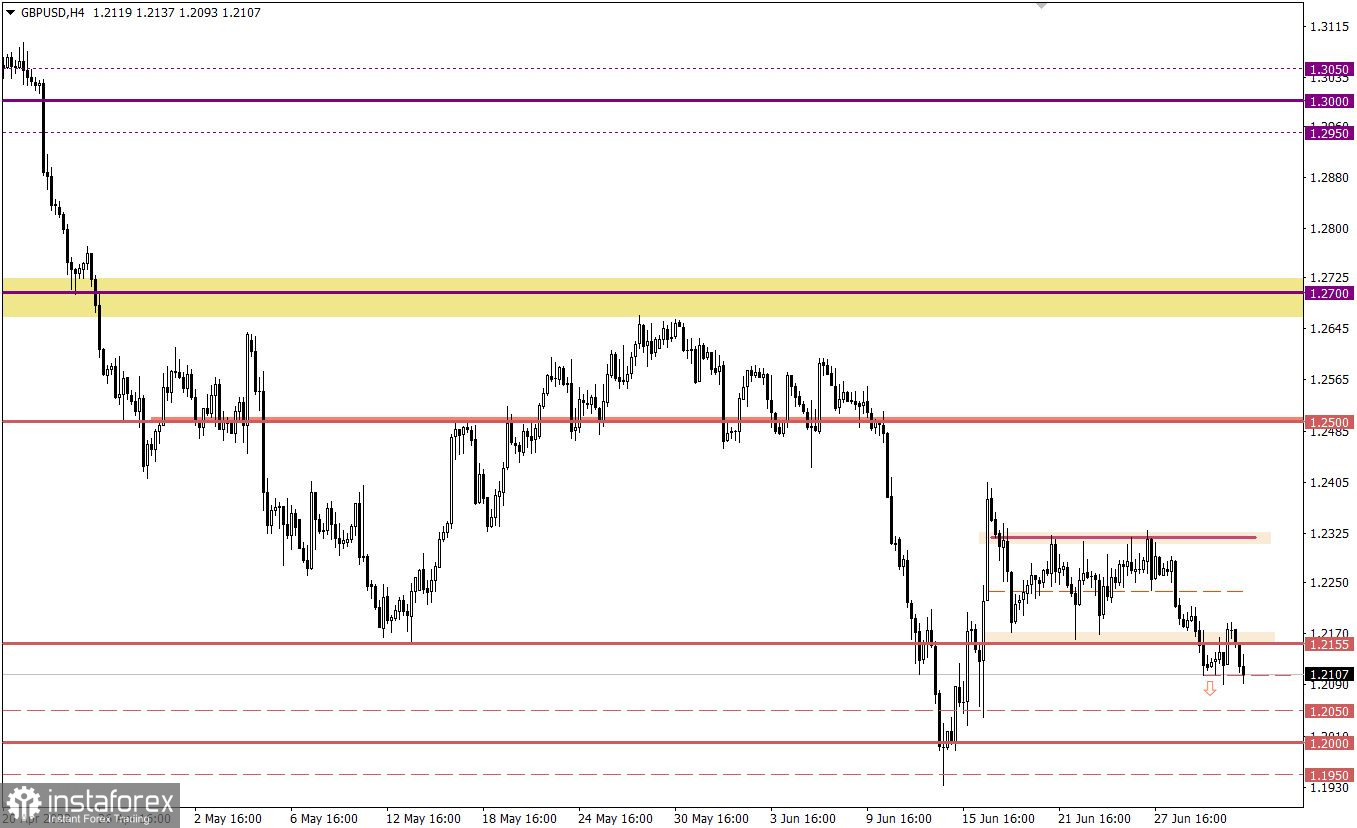
The GBPUSD currency pair, after a short pullback, resumed its decline. The area of the lower border of the previously passed flat 1.2155/1.2320 serves as resistance in the market, allowing sellers to increase the volume of short positions.

The final data on the index of business activity in the manufacturing sector of Europe, Britain, and the United States will be published today. However, these indicators will have little effect on anything, as they should only confirm preliminary estimates that have already been taken into account by the market. The only thing that can affect the market is the data on inflation in the EU, which is predicted to accelerate from 8.1% to 8.3%. Thus, inflationary pressure increases unrest within the EU economy, which allows for a sell-off of the euro.
It is worth noting that the subsequent increase in inflation once again indicates the possibility of an early increase in the ECB interest rate, which should take place during the upcoming meeting of the regulator's board.
Time targeting
EU inflation – 09:00 UTC
The previously passed level of 1.0500 currently serves as a resistance in the market. Thus, the existing rebound may indicate a consistent recovery of short positions, which in the future allows for a decline in the quote in the direction of 1.0350.
An alternative scenario will be considered by traders if the price holds above the 1.0500 level in a four-hour period. In this case, the quote may again resume the cycle of fluctuations within 1.0500/1.0600.
In this situation, keeping the price below the value of 1.2100 in a four-hour period will lead to a subsequent decrease in the pound sterling. This move allows for a move towards the psychologically important mark of 1.2000.
A candlestick chart view is graphical rectangles of white and black light, with sticks on top and bottom. When analyzing each candle in detail, you will see its characteristics of a relative period: the opening price, closing price, and maximum and minimum prices.
Horizontal levels are price coordinates, relative to which a stop or a price reversal may occur. These levels are called support and resistance in the market.
Circles and rectangles are highlighted examples where the price of the story unfolded. This color selection indicates horizontal lines that may put pressure on the quote in the future.
The up/down arrows are the reference points of the possible price direction in the future.
Díky analytickým přehledům společnosti InstaForex získáte plné povědomi o tržních trendech! Jako zákazníkovi společnosti InstaForex je Vám k dispozici velký počet bezplatných služeb umožňujících efektivní obchodování.


