 Zůstat
Obchodní podmínky
Nástroje


Trend analysis (fig. 1).
Today, the pair may continue to drop to 1.2166 – the Fibonacci retracement level of 23.6% (blue dotted line) from 1.2212 (the closing of yesterday's intraday candlestick). When testing this level, it may rebound to 1.2275 – the intraday candlestick that was formed yesterday. If the price hits this level, it is likely to resume an upward movement.
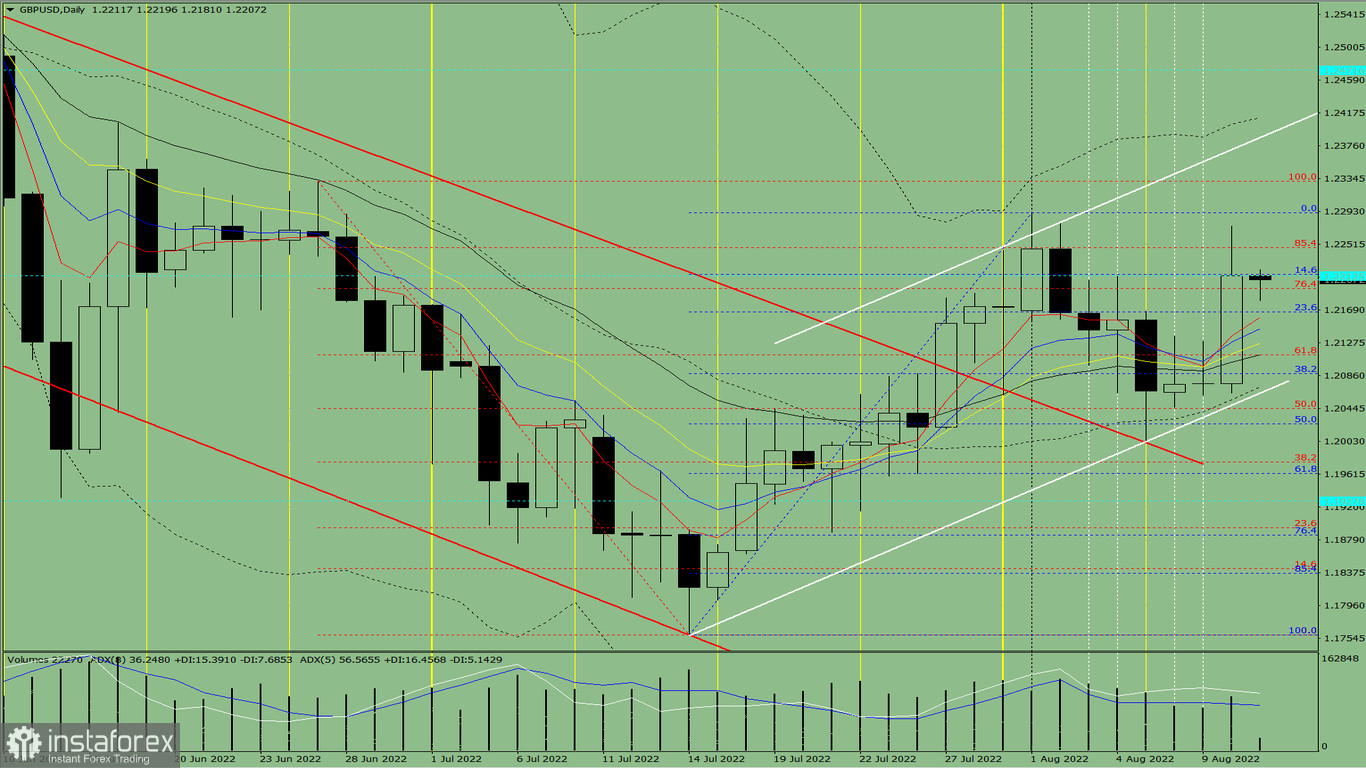
Fig. 1 (intraday chart).
Complex analysis:
- indicator analysis– up;- Fibonacci retracement levels – up;- trading volumes – up;- candlestick analysis – up;- trend analysis– up;- Bollinger bands – up;- weekly chart-up.
Conclusion
Today, the pair may continue to drop to 1.2166 – the Fibonacci retracement level of 23.6% (blue dotted line) from 1.2212 (the closing of yesterday's intraday candlestick). When testing this level, it may rebound to 1.2275 – the intraday candlestick that was formed yesterday. If the price hits this level, it is likely to resume an upward movement.
Alternatively, the price could decline to the target level of 1.2112 – the 21 average EMA (black thin line) from 1.2212 (closing of yesterday's intraday candlestick). When testing this level, the pair may rebound to 1.2275 – the intraday candlestick that was formed yesterday. After reaching this level, it may resume an upward movement.
Díky analytickým přehledům společnosti InstaForex získáte plné povědomi o tržních trendech! Jako zákazníkovi společnosti InstaForex je Vám k dispozici velký počet bezplatných služeb umožňujících efektivní obchodování.

