 Zůstat
Obchodní podmínky
Nástroje


The US broad market index S&P 500 (reflected as CFD #SPX in the trading terminal) broke through the key resistance level of 4185.00 (200 EMA on the daily chart) last week, rising to a 14-week high and the mark of 4277.00.
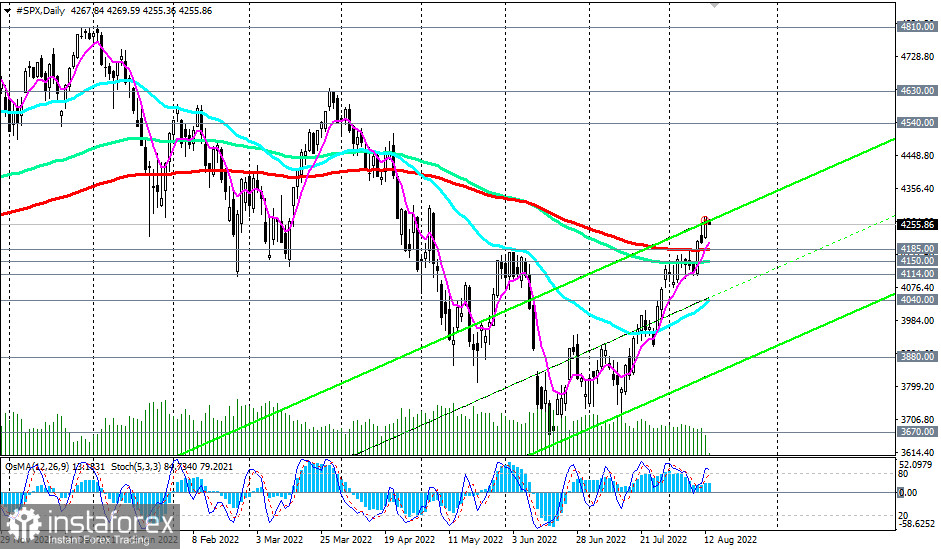
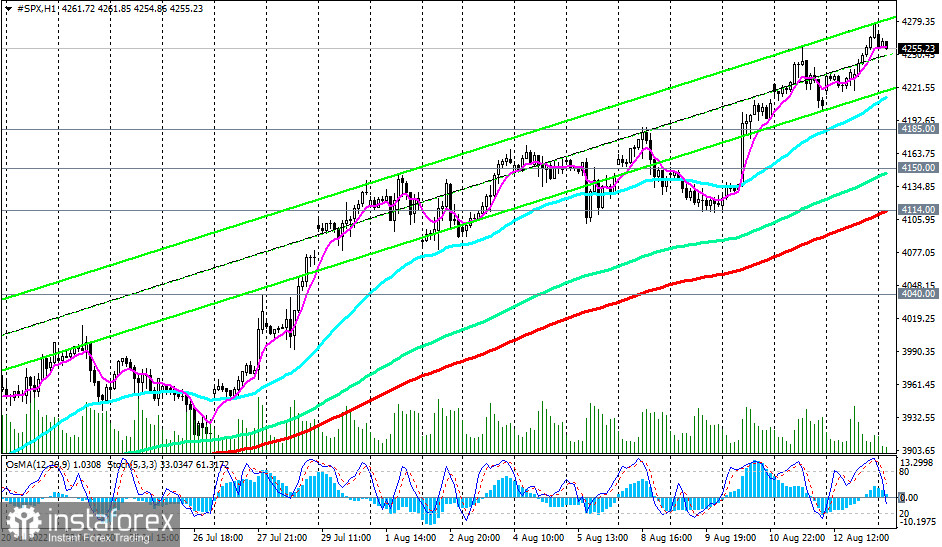
As of this writing, CFD #SPX is trading near 4255.00, also above important support levels 4114.00 (200 EMA on 1-hour chart), 4040.00 (200 EMA on 4-hour chart, 50 EMA on daily chart). The upper line of the ascending channel on the daily chart also passes through the level of 4255.00.
At the same time, technical indicators OsMA and Stochastic on the daily and weekly charts are on the side of buyers.
In the current situation (at least from a technical point of view), long positions seem preferable, and for now, it is necessary to focus on the possibility of opening them.
Probably, the breakdown of the local high at 4277.00 will be a signal for this.
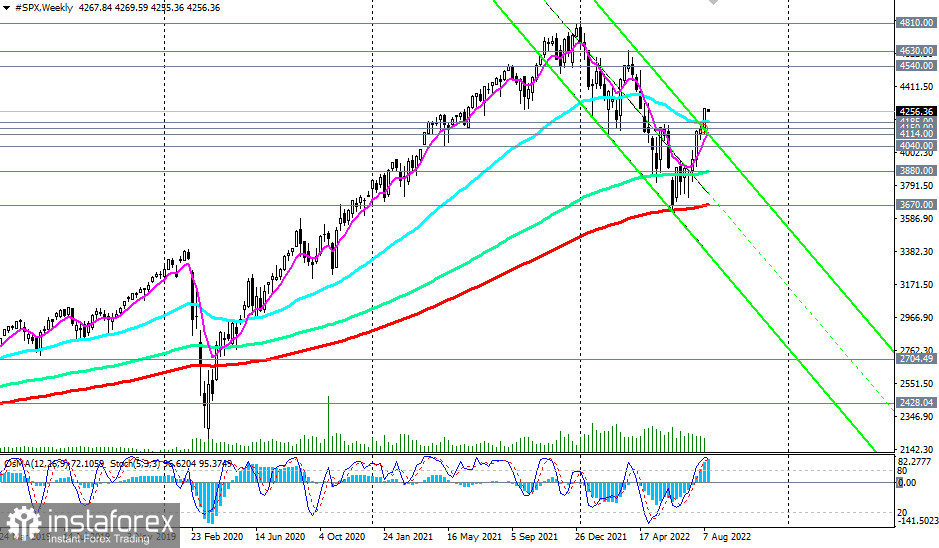
In an alternative scenario, and after the breakdown of the support levels of 4185.00, 4150.00, 4114.00, the S&P 500 will again head to the key long-term support level of 3670.00 (200 EMA on the weekly chart), which separates the multi-year bullish trend from the bearish one. Its breakdown may finally break the long-term global bullish trend of the S&P 500 and, perhaps, the entire American stock market.
Support levels: 4200.00, 4185.00, 4150.00, 4114.00, 4100.00, 4040.00, 3670.00, 3600.00
Resistance levels: 4277.00, 4300.00, 4400.00, 4540.00, 4630.00, 4810.00
Trading Tips
Sell Stop 4210.00.00. Stop-Loss 4280.00. Whole 4185.00, 4150.00, 4114.00, 4100.00, 4040.00, 3670.00, 3600.00
Buy Stop 4280.00. Stop-Loss 4210.00. Whole 4300.00, 4400.00, 4540.00, 4630.00, 4810.00
Díky analytickým přehledům společnosti InstaForex získáte plné povědomi o tržních trendech! Jako zákazníkovi společnosti InstaForex je Vám k dispozici velký počet bezplatných služeb umožňujících efektivní obchodování.


