 Zůstat
Obchodní podmínky
Nástroje


Details of the economic calendar for September 6
The further aggravation of the energy crisis in Europe puts pressure on the markets, which does not allow the euro to move into the stage of a full correction.
German Chancellor Olaf Scholz said yesterday that the energy crisis will last for several more years. This statement caused the euro to accelerate its decline.
Meanwhile, UK's construction Purchasing Managers' Index (PMI) was published, which rose to 49.2 instead of the expected decrease from 48.9 to 48.0. However, the market ignored the statistics.
During the American trading session, the US services Purchasing Managers' Index (PMI) was published, which fell more than expected from 47.3 to 43.7. Again, there was no reaction to the statistical data.
Analysis of trading charts from September 6
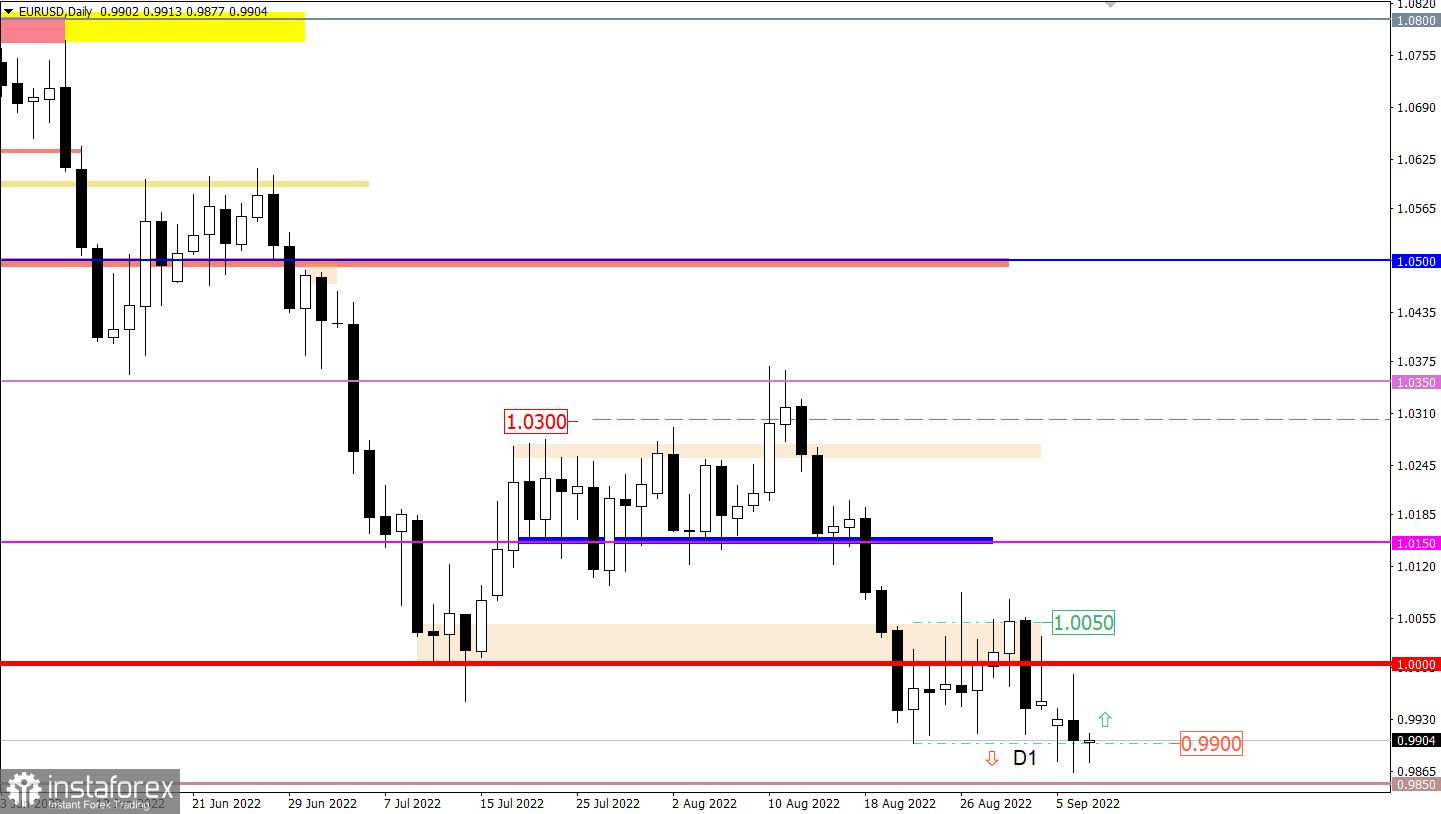
The EURUSD currency pair is stubbornly trying to prolong the downward trend, as indicated by a number of attempts by traders to stay below the 0.9900 level in the daily period. There is no clear signal of prolongation for the Tuesday period.
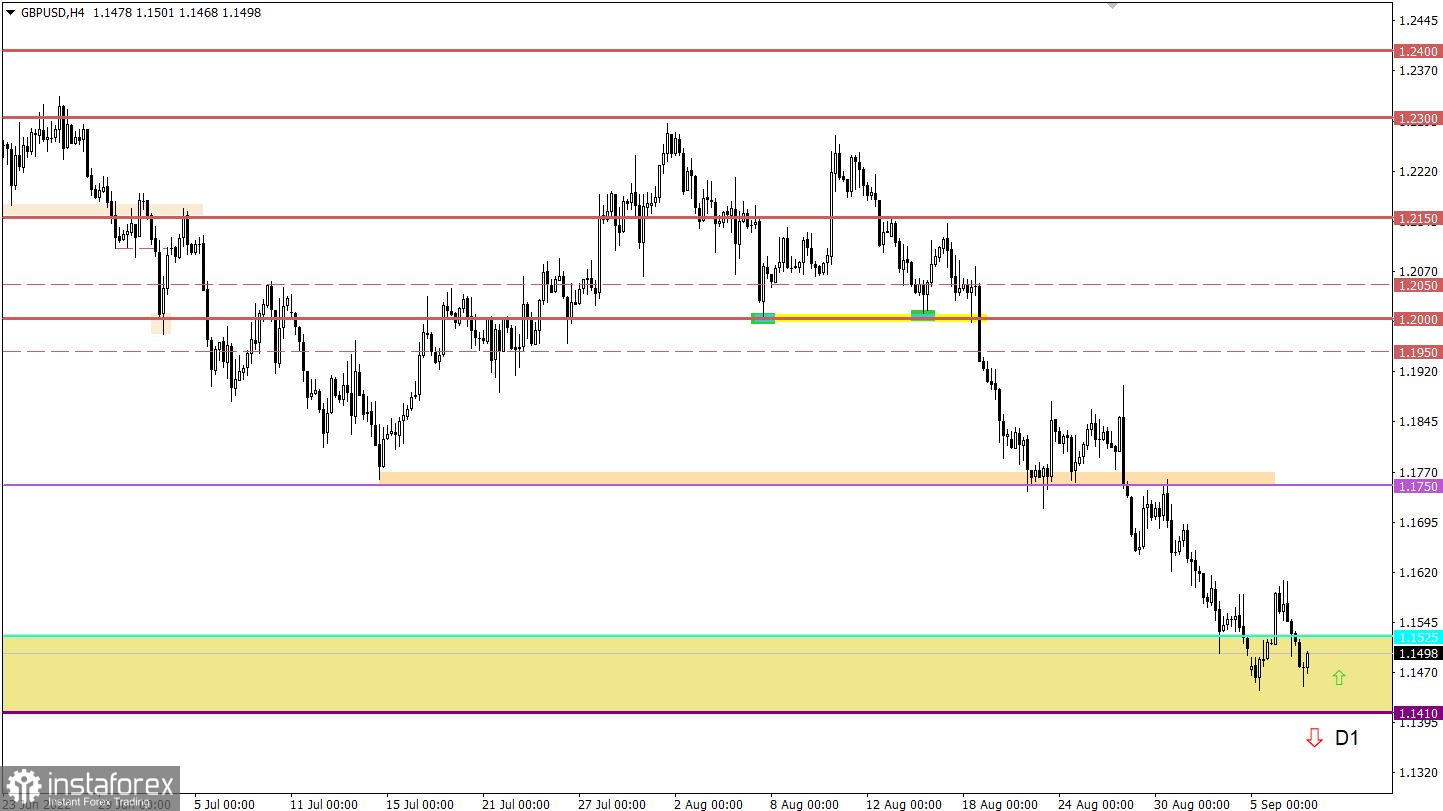
The GBPUSD currency pair, after a short pullback, again rushed down towards the local low of 2020 (1.1410). This move indicates the continuing downside mood among traders in the market.
It is worth noting that the pound sterling has a positive correlation with the euro. Thus, we observe identical cycles in the market.

Economic calendar for September 7
Today, the publication of the third estimate of Eurozone GDP is expected, where there will be no reaction in the market if the data coincides with the previous two estimates. If there is a discrepancy in the statistical data, then a speculative activity may appear depending on the indicators.
Time targeting:
EU GDP – 09:00 UTC
Trading plan for EUR/USD on September 7
Market participants still expect the price to hold below 0.9900 in the daily period. This move will indicate the possibility of further weakening of the euro towards 0.9500. It is worth considering that a variable level of 0.9850 stands in the way of the downward cycle. Thus, a confirming signal about the downward move will be received after its breakdown.
The upward scenario considers the absence of holding the price beyond the control values. In this case, another rebound is possible, with the price returning above the parity level.
Trading plan for GBP/USD on September 7
In order for a signal to prolong the long-term downward trend to appear, the quote needs to be firmly held below 1.1400 in the daily period.
In the opposite case, it is impossible to exclude the scenario of a price rebound from the 2020 low area with a subsequent amplitude of 1.1450/1.1600.
What is shown in the trading charts?
A candlestick chart view is graphical rectangles of white and black light, with sticks on top and bottom. When analyzing each candle in detail, you will see its characteristics of a relative period: the opening price, closing price, and maximum and minimum prices.
Horizontal levels are price coordinates, relative to which a stop or a price reversal may occur. These levels are called support and resistance in the market.
Circles and rectangles are highlighted examples where the price of the story unfolded. This color selection indicates horizontal lines that may put pressure on the quote in the future.
The up/down arrows are the reference points of the possible price direction in the future.
Díky analytickým přehledům společnosti InstaForex získáte plné povědomi o tržních trendech! Jako zákazníkovi společnosti InstaForex je Vám k dispozici velký počet bezplatných služeb umožňujících efektivní obchodování.

