 Zůstat
Obchodní podmínky
Nástroje


Trend analysis (Fig. 1).
On Tuesday, moving up from the level of 1.0671 (closing of yesterday's daily candlestick), the price will try to reach the 38.2% retracement level of 1.0875 (blue dotted line). Should the quote test the barrier, the price will rise to the target standing at the 50.0% retracement level of 1.0875 (blue dotted line) and then go down.
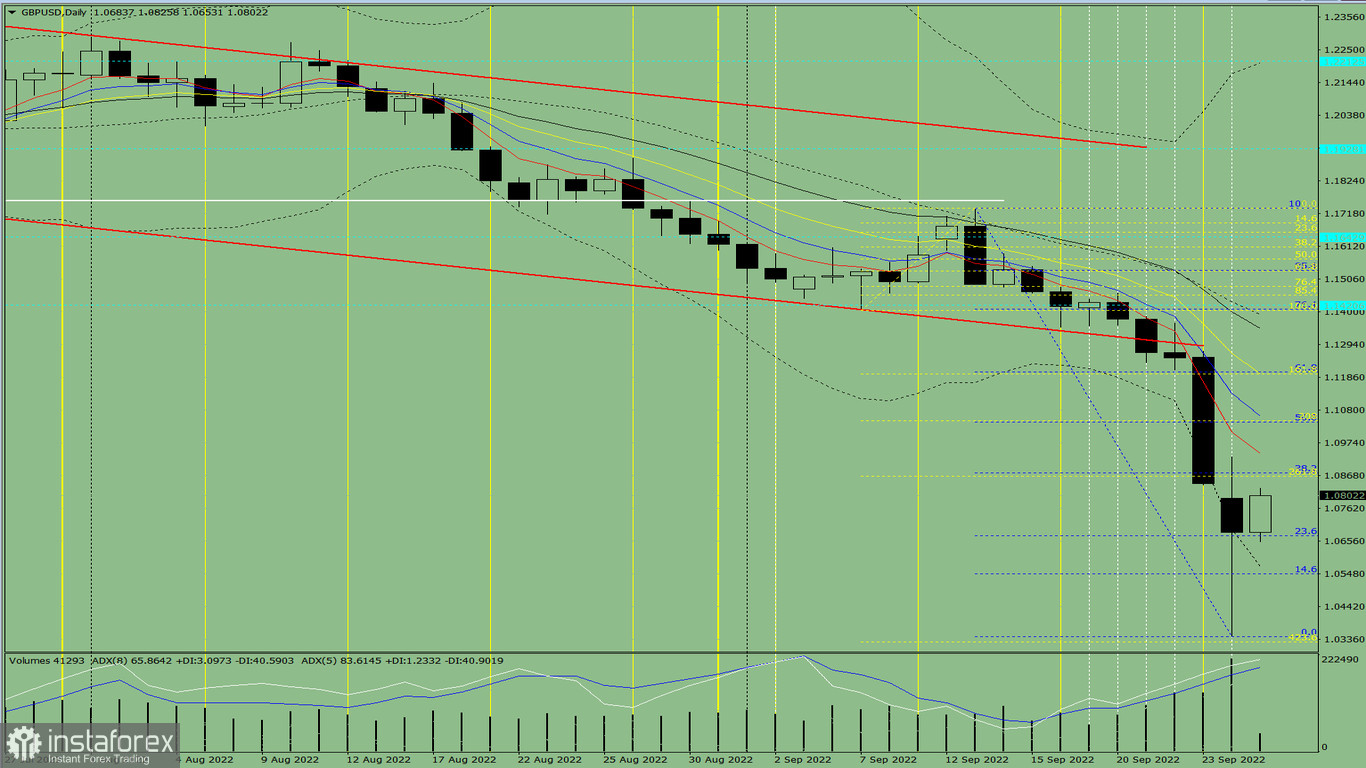
Fig. 1 (daily chart)
Complex analysis:
- indicator analysis - up
- Fibonacci levels - up
- volumes - up
- candlestick analysis - up
- trend analysis - up
- Bollinger bands - up
- weekly chart - up
Final thoughts:
Today, moving up from the level of 1.0671 (closing of yesterday's daily candlestick), the price will try to reach the 38.2% retracement level of 1.0875 (blue dotted line). Should the quote test the barrier, the price will rise to the target standing at the 50.0% retracement level of 1.0875 (blue dotted line) and then go down.
Alternative scenario: moving down from the level of 1.0671 (closing of yesterday's daily candlestick), the quote will try to get to the 14.6% retracement level of 1.0546 (blue dotted line). If the barrier is tested, the price could retrace up to the 38.2% retracement level of 1.0875 (blue dotted line).
Díky analytickým přehledům společnosti InstaForex získáte plné povědomi o tržních trendech! Jako zákazníkovi společnosti InstaForex je Vám k dispozici velký počet bezplatných služeb umožňujících efektivní obchodování.


