 Zůstat
Obchodní podmínky
Nástroje


Trend analysis
EUR/USD will increase this October, starting from 0.9804 (closing of the September monthly candle) to 0.9994, which is the historical resistance level (blue dotted line). Then, it will go to the 23.6% retracement level at 1.0198 (red dotted line) and the historical resistance level at 1.0373 (blue dotted line), before turning down again.
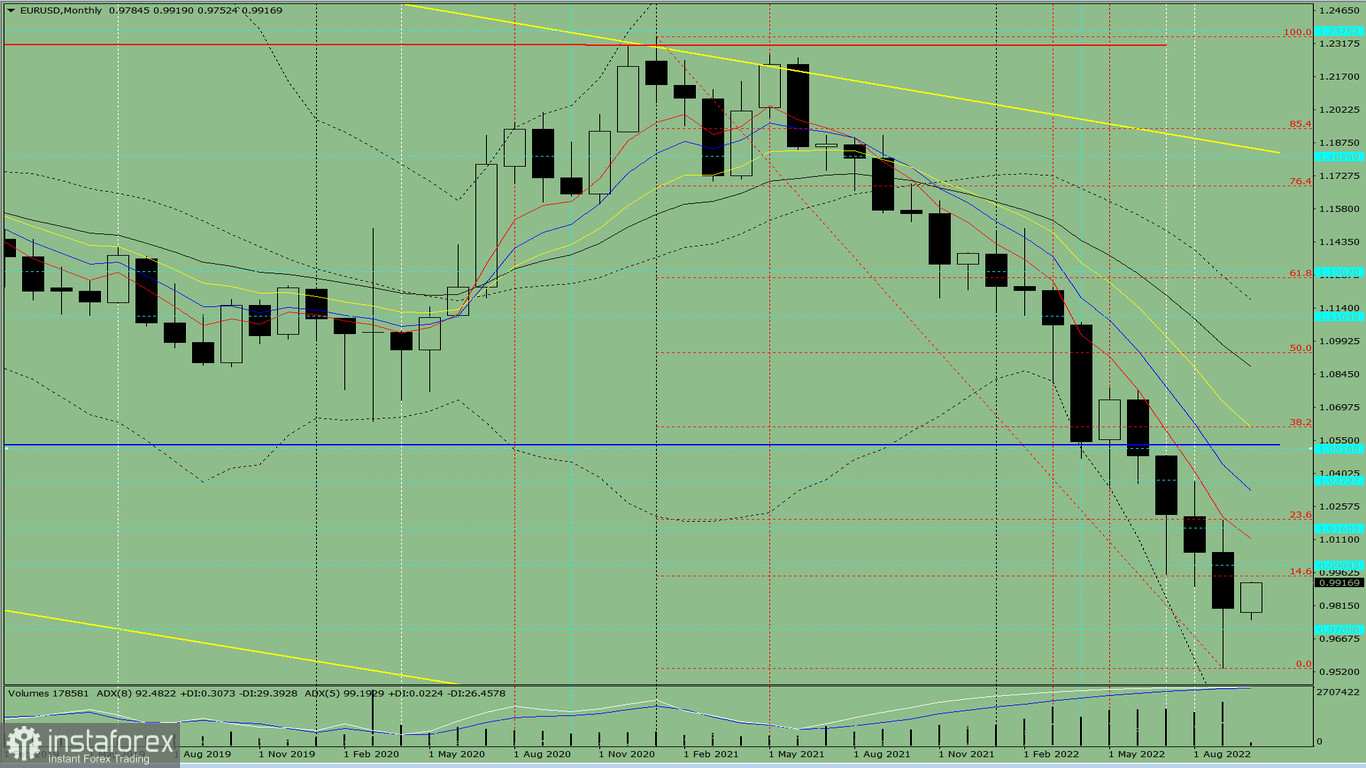
Fig. 1 (monthly chart)
Comprehensive analysis:
Indicator analysis - uptrend
Fibonacci levels - uptrend
Volumes - uptrend
Candlestick analysis - uptrend
Trend analysis - uptrend
Bollinger bands - uptrend
All this points to an upward movement in EUR/USD.
Conclusion: The pair will have a bullish trend, with no first lower shadow on the monthly white candle (the first week of the month is white) and a second upper shadow (the last week is black).
Throughout the month, quotes will climb from 0.9804 (closing of the September monthly candle) to the historical resistance level at 0.9994 (blue dotted line), go to the 23.6% retracement level at 1.0198 (red dotted line) and the historical resistance level at 1.0373 (blue dotted line), then turn down again.
Alternatively, the pair could rise from 0.9804 (closing of the September monthly candle) to the 23.6% retracement level at 1.0198 (red dotted line), then bounce down to the historical resistance level at 0.9994 (dashed blue line). Upward movement may resume from this level.
Díky analytickým přehledům společnosti InstaForex získáte plné povědomi o tržních trendech! Jako zákazníkovi společnosti InstaForex je Vám k dispozici velký počet bezplatných služeb umožňujících efektivní obchodování.

