 Zůstat
Obchodní podmínky
Nástroje


The GBP/USD pair exactly repeated the dynamics of the EUR/USD pair on Wednesday. A fall began in the European trading session, which at the moment is already 230 points. For the British currency, this distance is considered normal in the current circumstances. Recall that the period of hyper volatility began about two weeks ago with a collapse of 600 points. Therefore, 200 points a day should not be surprising. The pound, unlike the euro, remains within the ascending channel and has a good potential for falling without the risk of a reversal of the upward trend. Thus, we can observe a decrease in quotes at least until the end of the week, but the upward trend will continue. In addition to the US statistics, which we have already discussed in the article on the euro, the index of business activity in the service sector was published in the UK. It fell from 50.9 to 50.0 in September, but the pound's fall began after this report was published. To be honest, we are skeptical about the view that the euro and pound fell on Wednesday due to business activity indexes. There were formal reasons for the market to sell both pairs, but these indices are not so significant, and their values were not so resonant that we saw such strong falls. We believe that to a greater extent we are talking about a technical correction, although the statistics could have influenced the movement of both pairs.
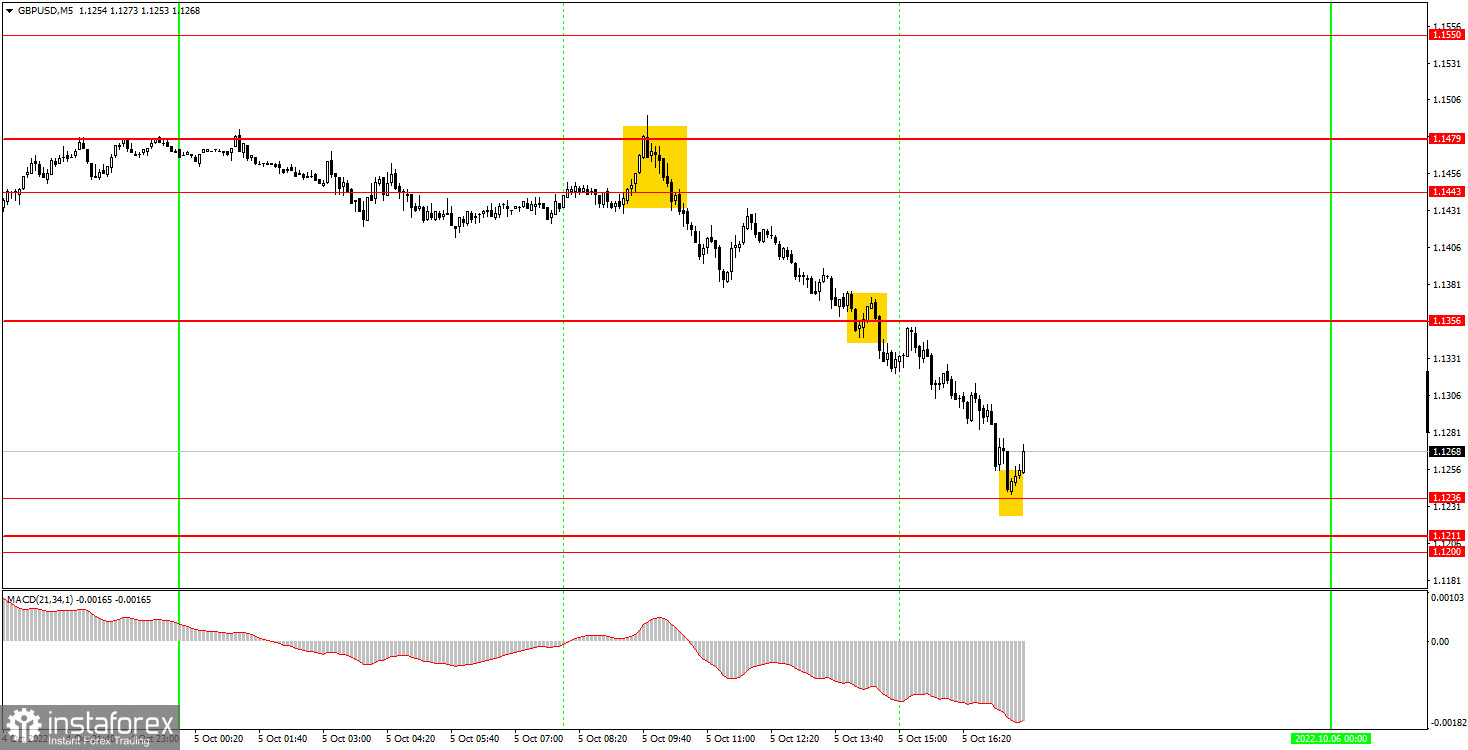
Everything was just fine in regards to Wednesday's trading signals on the 5-minute timeframe. Once again, we are convinced that when there is a good trend movement, trading is easy and simple! The first signal was formed in the area of 1.1443-1.1479 in the form of a rebound. After that, the price moved all day in only one direction, and by the evening it was near the level of 1.1236, where it was necessary to take profit on a short position. It amounted to at least 160 points. Moreover, none of the signals formed was ambiguous, and novice traders did not even have to think for a long time about what to do when forming this or that signal.
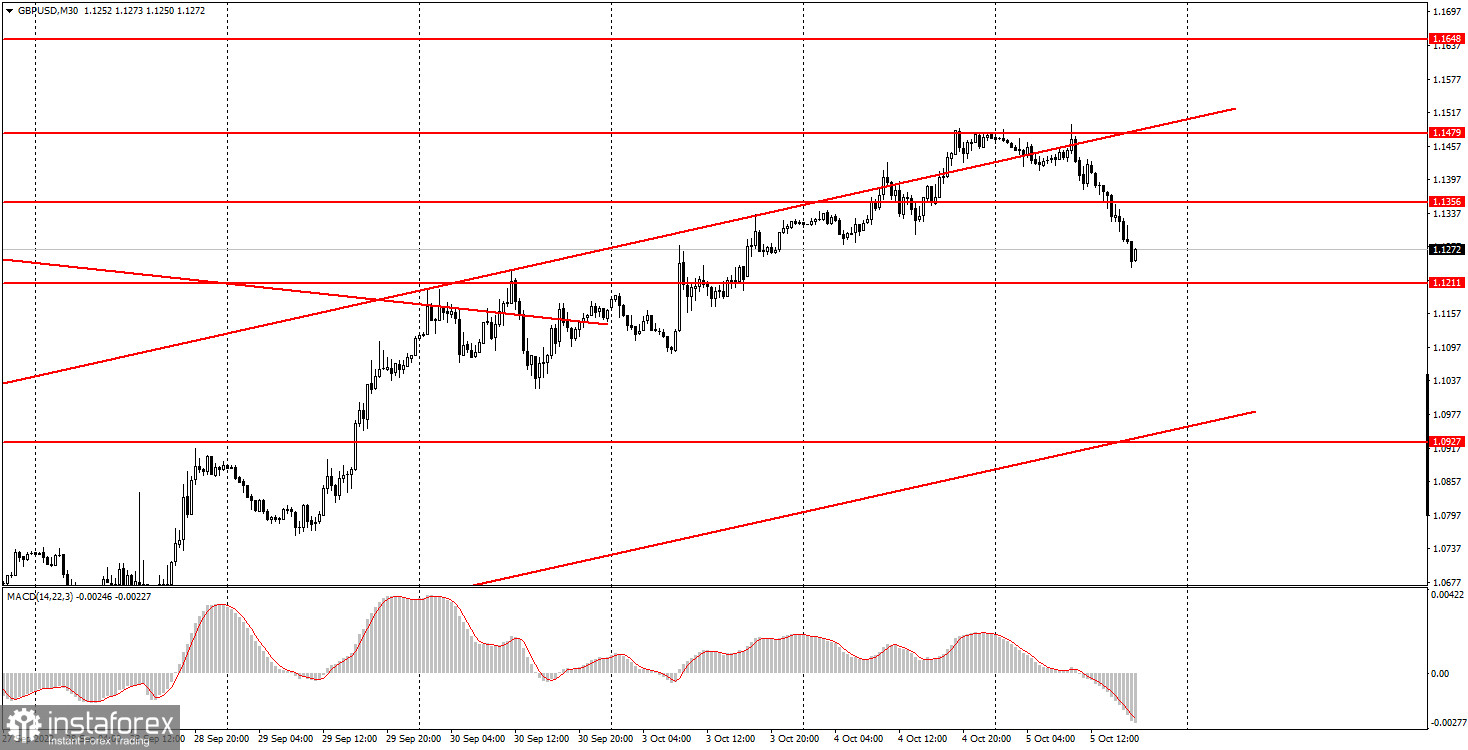
The pound/dollar pair continues to remain within the ascending channel on the 30-minute TF. Volatility remains high, and the pound moves in any direction, even without the help of a fundamental or macroeconomic background. After the pair rose by 1100 points, a downward correction was the normal course of events. The pound has the opportunity to fall another 200 points. Next, it will be decided whether the new upward trend will continue. On the 5-minute TF on Thursday, it is recommended to trade at the levels of 1.1024, 1.1200-1.1211-1.1236, 1.1356, 1.1443, 1.1479, 1.1550, 1.1608. When the price passes after opening a deal in the right direction for 20 points, Stop Loss should be set to breakeven. The UK is set to publish only a report on business activity in the construction sector, and in the US - a report on applications for unemployment benefits. Both are not important, but the market doesn't need much right now. If there is a formal reason to actively trade, it does so!
1) The signal strength is calculated by the time it took to form the signal (bounce or overcome the level). The less time it took, the stronger the signal.
2) If two or more deals were opened near a certain level based on false signals (which did not trigger Take Profit or the nearest target level), then all subsequent signals from this level should be ignored.
3) In a flat, any pair can form a lot of false signals or not form them at all. But in any case, at the first signs of a flat, it is better to stop trading.
4) Trade deals are opened in the time period between the beginning of the European session and until the middle of the US one, when all deals must be closed manually.
5) On the 30-minute TF, using signals from the MACD indicator, you can trade only if there is good volatility and a trend, which is confirmed by a trend line or a trend channel.
6) If two levels are located too close to each other (from 5 to 15 points), then they should be considered as an area of support or resistance.
Support and Resistance Levels are the Levels that serve as targets when buying or selling the pair. You can place Take Profit near these levels.
Red lines are the channels or trend lines that display the current trend and show in which direction it is better to trade now.
The MACD indicator (14,22,3) consists of a histogram and a signal line. When they cross, this is a signal to enter the market. It is recommended to use this indicator in combination with trend lines (channels and trend lines).
Important speeches and reports (always contained in the news calendar) can greatly influence the movement of a currency pair. Therefore, during their exit, it is recommended to trade as carefully as possible or exit the market in order to avoid a sharp price reversal against the previous movement.
Beginners on Forex should remember that not every single trade has to be profitable. The development of a clear strategy and money management are the key to success in trading over a long period of time.
Díky analytickým přehledům společnosti InstaForex získáte plné povědomi o tržních trendech! Jako zákazníkovi společnosti InstaForex je Vám k dispozici velký počet bezplatných služeb umožňujících efektivní obchodování.

