 Zůstat
Obchodní podmínky
Nástroje


Overview :
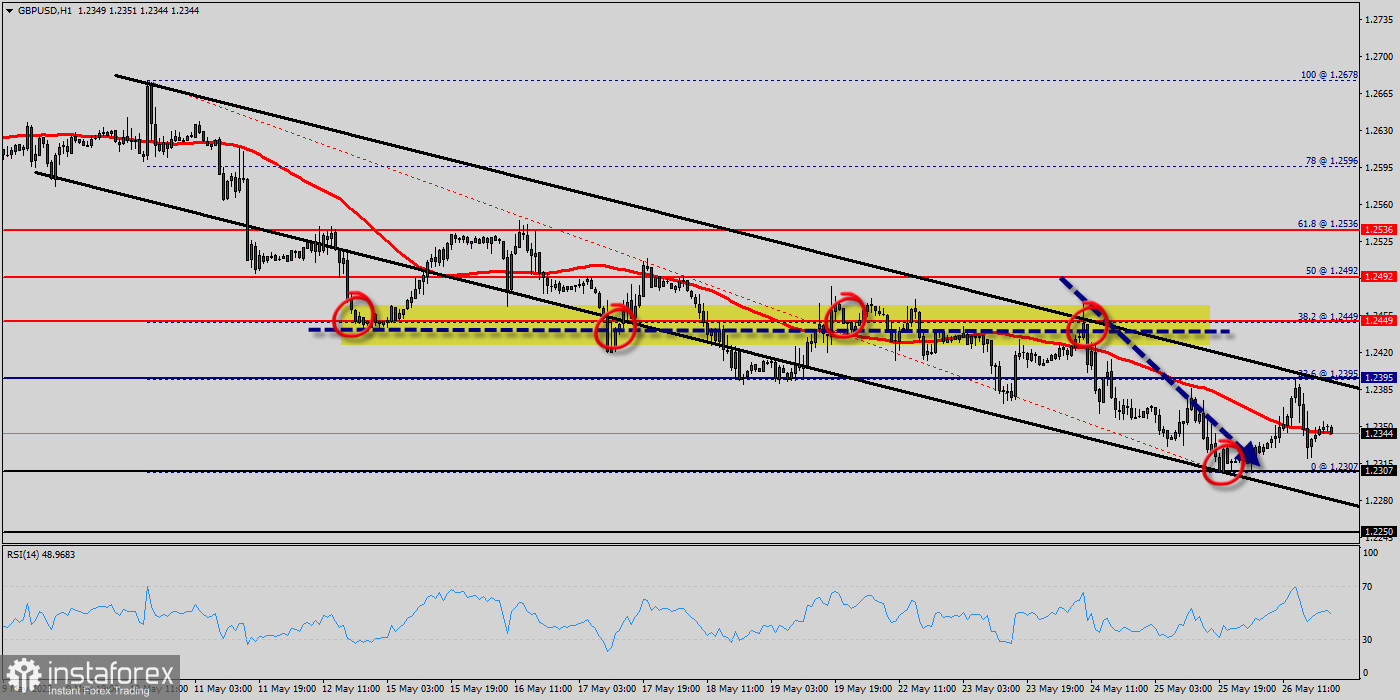
The GBP/USD pair continues to move downwards from the level of 1.2489. Yesterday, the pair dropped from the level of 1.2489 (this level of 1.2489 coincides with the ratio of 38.2% Fibonacci) to the bottom around 1.2372. However, the trend rebounded from the bottom of 1.2372 to close at 1.2417.
The first resistance level is seen at 0.9965 followed by 1.2525 (the weekly pivot point), while daily support 1 is found at 1.2372. Also, the level of 1.2525 represents a weekly pivot point for that it is acting as major resistance/support this week.
Amid the previous events, the pair is still in a downtrend, because the GBP/USD pair is trading in a bearish trend from the new resistance line of 1.2525 towards the first support level at 1.2372 in order to test it. If the pair succeeds to pass through the level of 1.2372, the market will indicate a bearish opportunity below the level of 1.2372.
The price spot of 1.2525 remains a significant resistance zone. Therefore, there is a possibility that the GBP/USD pair will move downside and the structure of a fall does not look corrective. It will indicate the bearish opportunity below 1.2525, sell below 1.2525 or 1.2424 with the first target at 1.2372 in order to test yesterday's bottom.
If the GBP/USD pair is able to break out the bottom at 1.2372, the market will decline further to 1.2300 in order to test the weekly support 2. Also, it should be noticed that support 1 is seen at the level of 1.2300. Thus, the market is indicating a bearish opportunity below the above-mentioned support levels, for that the bullish outlook remains the same as long.
On the other hand, if a breakout happens at the resistance level of 1.0014, then this scenario may be invalidated. The GBP/USD pair is in downtrend since a week! so, the GBP/USD pair is really a great fortune. Our target 1.2273 in the next two days. Today, the GBP/USD pair is trading below the weekly pivot point 1.2399.
The GBP/USD pair broke support which turned to a minor resistance at the price of 1.2469 last week. The price of 1.2469 is expected to act as major resistance. As long as there is no daily close below 1.2469, there are no chances of a fresh increase below 1.2469 (R1) in the H1 time frame. The support levels will be placed at the prices of 1.2332 and 1.2273.
As long as there is no daily close below 1.2469, there are chances of breaking the bottom of 1.2273 in coming 48hours. The volatility is very high for that the the GBP/USD pair is still moving between 1.2469 and 1.2273 in coming hours. As a result, the market is likely to show signs of a bullish trend again. Hence, it will be good to sell below the level of 1.2469 with the first target at 1.2332 and further to 1.2273 in order to test the weekly last bearish wave.
However, if the GBP/USD is able to break out the daily resistance at 1.2469, the market will rise further to 1.2524 to approach resistance 2 in coming days. Daily
Forecast :
According to the previous events the price is expected to remain between 1.2469 and 1.2273 levels. Sell-deals are recommended below 1.2469 with the first target seen at 1.2332.
The movement is likely to resume to the point 1.2303 and further to the point 1.2469.
Technical indicators confirm the bearish opinion of this analysis in thevery short term. However, be careful of excessive bearish movements. It is appropriate to continue watching any excessive bearish movements or scanner detections which might lead to a small bullish correction.
From this point, the pair is likely to begin a descending movement to the point of 1.2469 and further to the level of 1.2273. The level of 1.2273 will act as strong support and the double bottom is already set at the point of 1.2273. This would suggest a bearish market because the RSI indicator is still in a negative area and does not show any trend-reversal signs.
The pair is expected to drop lower towards at least 1.2332 in order to test the second support (1.2273). On the other hand, if the EUR/USD pair fails to break through the first support of 1.2332 today, the market will move upwards continuing the development of the bullish trend to the level 1.2524 (double top).
Díky analytickým přehledům společnosti InstaForex získáte plné povědomi o tržních trendech! Jako zákazníkovi společnosti InstaForex je Vám k dispozici velký počet bezplatných služeb umožňujících efektivní obchodování.


