 Zůstat
Obchodní podmínky
Nástroje


The EUR/USD pair opened below the weekly pivot point (1.0789). It continued to move downwards from the level of 1.0789 to the bottom around 1.0636. But the pair has rebounded from the bottom of 1.0636 to close at 1.0762.
Today, the first support level is seen at 1.0695, and the price is moving in a bearish channel now. Furthermore, the price has been set below the strong resistance at the level of 1.0789, which coincides with the 78% Fibonacci retracement level. This resistance has been rejected several times confirming the downtrend.
Additionally, the RSI starts signaling a downward trend. As a result, if the EUR/USD pair is able to break out the first support at 1.0753, the market will decline further to 1.0695 in order to test the weekly support 2.
Right now, the first resistance level is seen at 1.0789 followed by 1.0832, while daily support 1 is seen at 1.0753. Furthermore, the moving average (100) starts signaling a downward trend; therefore, the market is indicating a bearish opportunity below 1.0753.
So it will be good to sell at 1.0753 with the first target of 1.0695. It will also call for a downtrend in order to continue towards 1.0636. The strong daily support is seen at the 1.0636 level, which represents a new double bottom on the H1 chart. According to the previous events, we expect the EUR/USD pair to trade between 1.0789 and 1.0636 in coming hours.
The price area of 1.0789 remains a significant resistance zone. Thus, the trend is still bearish as long as the level of 1.0789 is not broken. On the contrary, in case a reversal takes place and the EUR/USD pair breaks through the resistance level of 1.0789, then a stop loss should be placed at 1.0850.
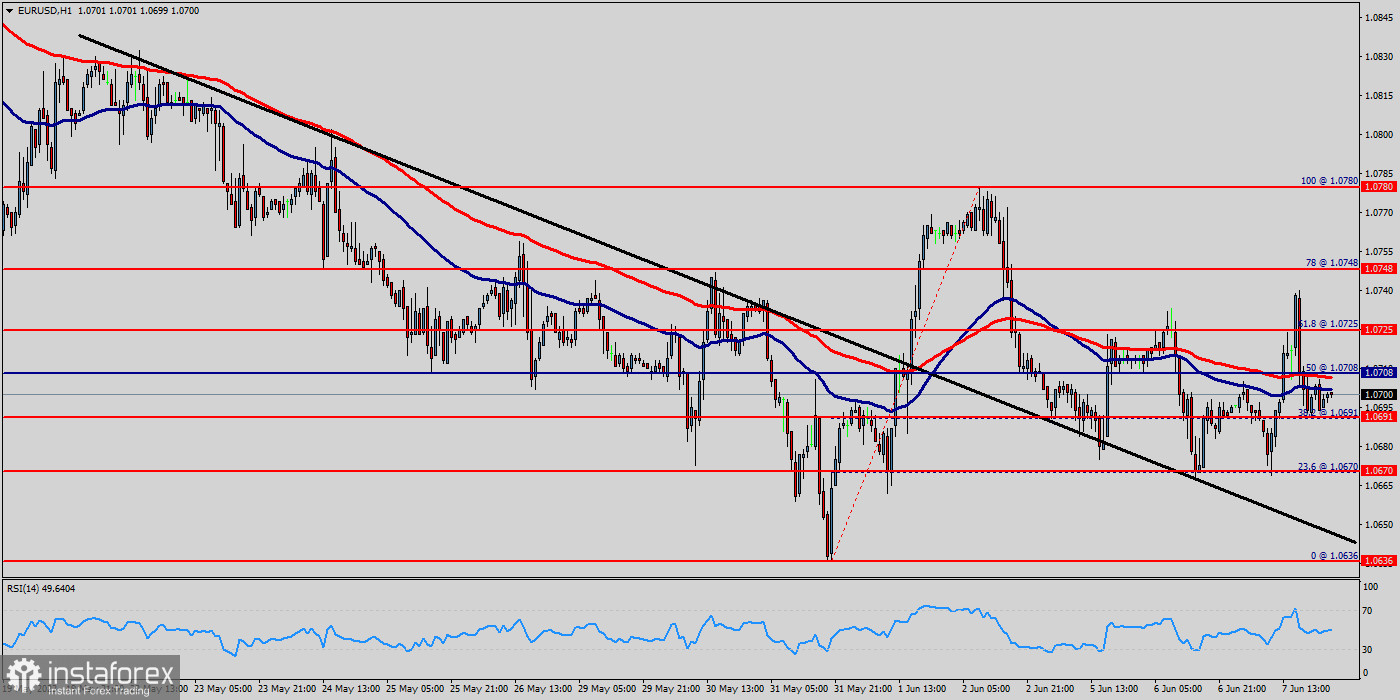
The EUR/USD pair steadies near 1.0715 after USD slide. The EUR/USD pair reached a peak of 1.0715 following the release of a weak ISM Services PMI report from the US. The EUR/USD pair is currently hovering near the 1.0715 level, unchanged for the day. The EUR/USD pair trades with modest losses, not far above the two-week low posted last week at 1.0636.
Technical readings in the daily chart favor a downward extension as a bearish 50 Simple Moving Average (SMA) heads south below a flat 100 SMA, both above the current level. Also, the pair remains above a critical static support level, the 23.6% Fibonacci retracement of the 2023 yearly slump at 1.0682.
Finally, technical indicators remain within positive levels, with neutral-to-bullish slopes. The EUR/USD pair broke resistance which turned to strong support at the level of 1.0682 yesterday. The level of 1.0682 coincides with 23.6% of Fibonacci, which is expected to act as major support today. Since the trend is above the 23.6% Fibonacci level, the market is still in an uptrend.
From this point, the EUR/USD pair is continuing in a bullish trend from the new support of 1.0682. Currently, the price is in a bullish channel.
According to the previous events, we expect the EUR/USD pair to move between 1.0682 and 1.0789. On the H1 chart, resistance is seen at the levels of 1.0757 and 1.0789. Also, it should be noticed that, the level of 1.0734 represents the daily pivot point. Therefore, strong support will be formed at the level of 1.0682 providing a clear signal to buy with the targets seen at 1.0734.
If the trend breaks the support at 1.0734 (first resistance) the pair will move upwards continuing the development of the bullish trend to the level 1.0789 in order to test the daily resistance 2. However, stop loss is to be placed below the level of 1.0636 - last bearish wave.
Díky analytickým přehledům společnosti InstaForex získáte plné povědomi o tržních trendech! Jako zákazníkovi společnosti InstaForex je Vám k dispozici velký počet bezplatných služeb umožňujících efektivní obchodování.


