 Zůstat
Obchodní podmínky
Nástroje


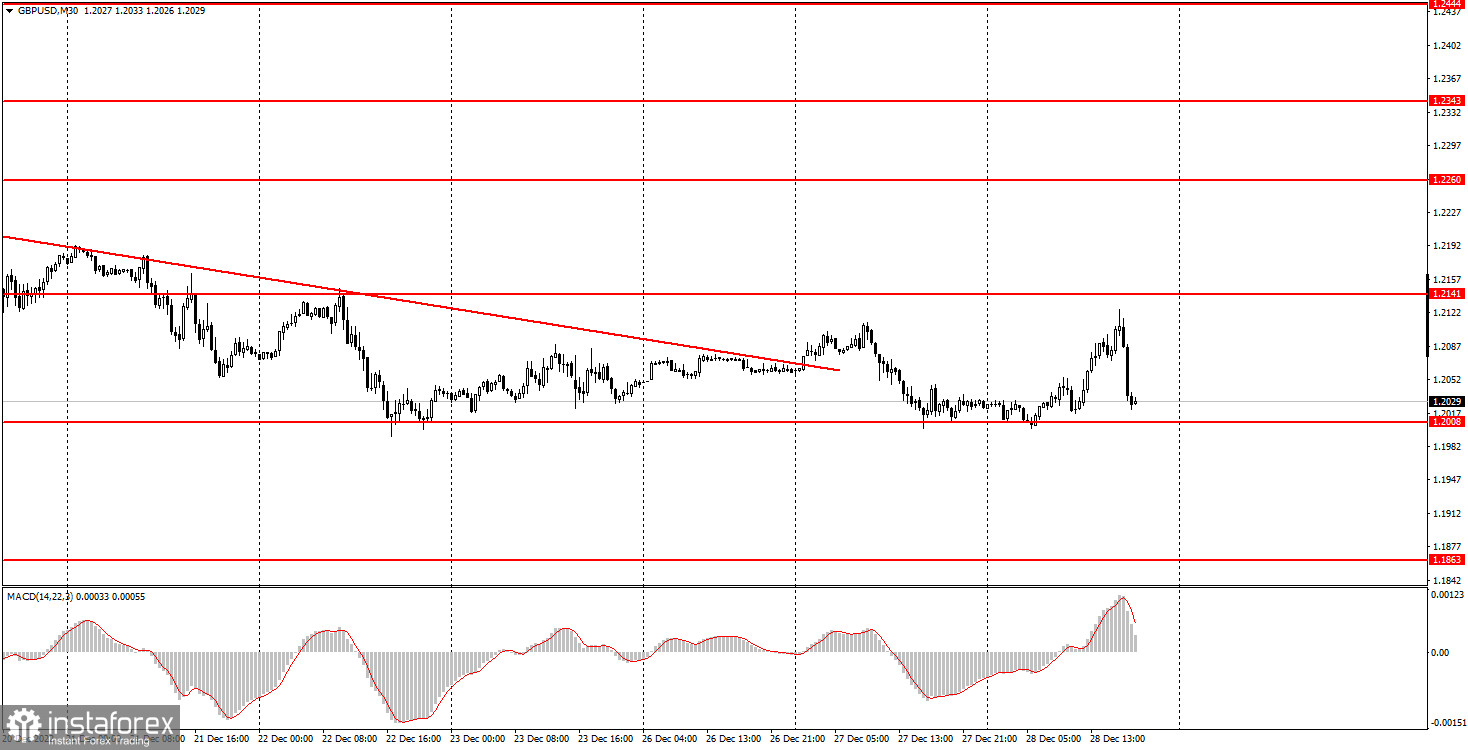
GBP/USD showed quite interesting movements on Wednesday, but unfortunately now we can say that the pair is also in a flat. The price has been trading between 1.2008 and 1.2141 for the last five days. That is why the New Year holidays reached the British currency as well. Now the flat might last up to several weeks or even months. I expect the option with less horizontal movement, but anything can happen. All in all, the pound has entered a bearish correction at least a little bit, as we expected. Now it is up to the euro, which is still around its local highs. Anyway, we should wait for the time when both pairs leave the horizontal channel. Or trade for a rebound from their respective limits.
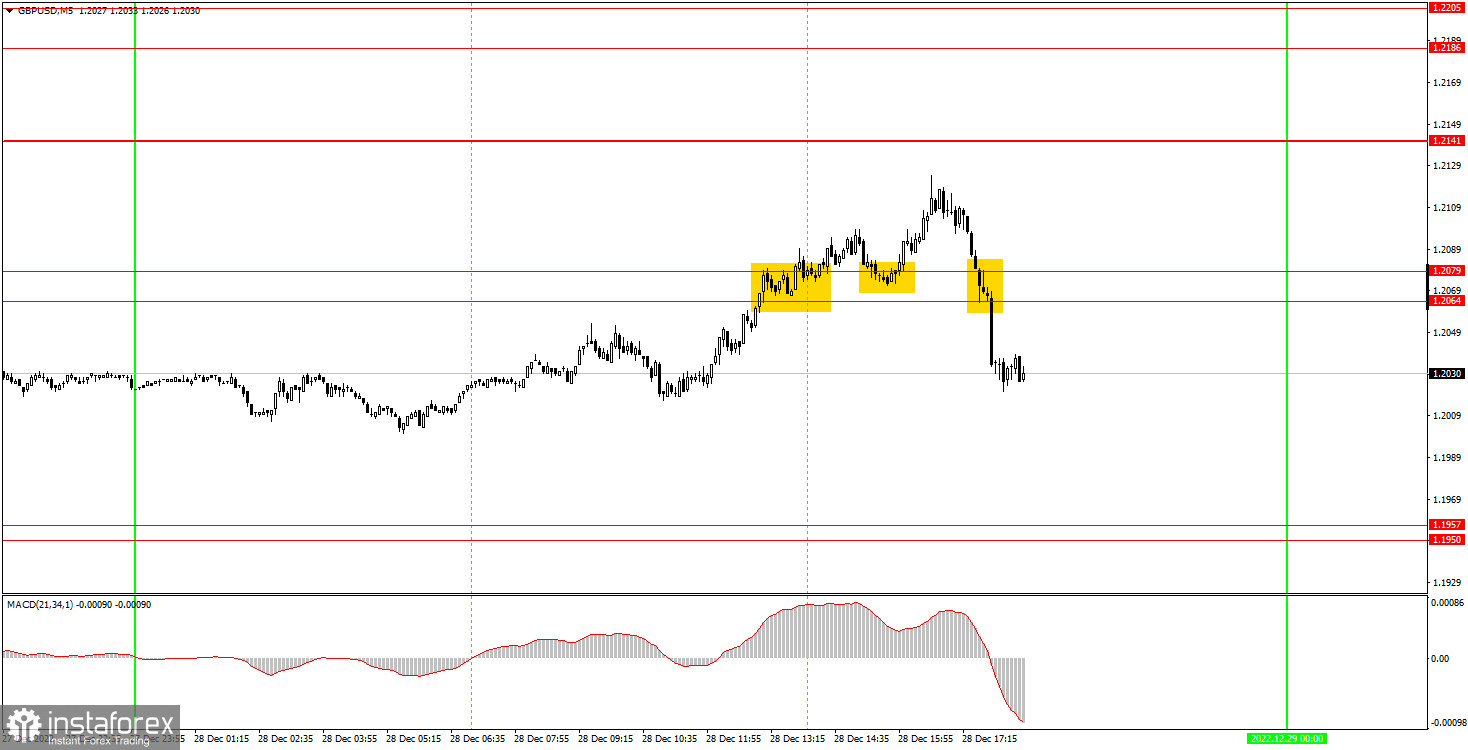
On the 5-minute chart, you can clearly see that the pair did not stand in one place. Nevertheless, Wednesday's trading signals were not the best. All of them were formed in the area of 1.2064-1.2079. GBP crossed this area at first, after which the pair managed to go up 35 pips, but then it failed to reach the nearest target of 1.2141. Therefore, the position was closed by Stop Loss at breakeven. A sell signal followed near the same area. However, the candlestick, on which it was formed, turned out to be very strong and the price suddenly moved 30 points below the area. 30 pips doesn't seem too much, but we would not risk opening a position using such a signal when facing a flat. But if beginners still opened a position, they wouldn't make a loss, because the entire movement ended with this candle.
On the 30-minute time chart, GBP maintains a downtrend, even though the trend line has lost its relevance. At the same time, take note that the pair has been in the horizontal channel for five days, so there is a high probability that the flat will still persist. On the 5-minute chart, it is recommended to trade at the levels 1.1793, 1.1863-1.1877, 1.1950-1.1957, 1.2008, 1.2064-1.2079, 1.2141, 1.2186-1.2205. As soon as the price passes 20 pips in the right direction, you should set a Stop Loss to breakeven. There are no important events or reports in the UK or US. Thus, there will be nothing to react to and there's still a high probability of a flat.
1) The strength of the signal is determined by the time it took the signal to form (a rebound or a breakout of the level). The quicker it is formed, the stronger the signal is.
2) If two or more positions were opened near a certain level based on a false signal (which did not trigger a Take Profit or test the nearest target level), then all subsequent signals at this level should be ignored.
3) When trading flat, a pair can form multiple false signals or not form them at all. In any case, it is better to stop trading at the first sign of a flat movement.
4) Trades should be opened in the period between the start of the European session and the middle of the US trading hours when all positions must be closed manually.
5) You can trade using signals from the MACD indicator on the 30-minute time frame only amid strong volatility and a clear trend that should be confirmed by a trendline or a trend channel.
6) If two levels are located too close to each other (from 5 to 15 pips), they should be considered support and resistance levels.
Support and Resistance levels are the levels that serve as targets when buying or selling the pair. You can place Take Profit near these levels.
Red lines are channels or trend lines that display the current trend and show in which direction it is better to trade now.
The MACD indicator (14, 22, and 3) consists of a histogram and a signal line. When they cross, this is a signal to enter the market. It is recommended to use this indicator in combination with trend patterns (channels and trendlines).
Important announcements and economic reports that can be found on the economic calendar can seriously influence the trajectory of a currency pair. Therefore, at the time of their release, we recommend trading as carefully as possible or exiting the market in order to avoid sharp price fluctuations.
Beginners on Forex should remember that not every single trade has to be profitable. The development of a clear strategy and money management is the key to success in trading over a long period of time.
Díky analytickým přehledům společnosti InstaForex získáte plné povědomi o tržních trendech! Jako zákazníkovi společnosti InstaForex je Vám k dispozici velký počet bezplatných služeb umožňujících efektivní obchodování.


