 Zůstat
Obchodní podmínky
Nástroje


On Wednesday, the EUR/USD currency pair started trading up again after adjusting to the moving average line. Again, we observed a very typical technical image: the euro currency microscopically sank before starting to rise again. The most intriguing aspect is that there was no justification for this yesterday. However, what can you do if the market perceives any communication channel as supporting the euro currency? The EU released its December inflation report in the morning. It would appear to be a significant report, but this was the indicator's second and final estimate for December, and it was identical to the first. In addition, the report stated that inflation decreased to 9.2%, or by as much as 0.9%. Such drop rates can be described as "extremely quick." The decline in inflation is a "dovish" factor for the euro, though, since it may prompt the ECB to resist a swift increase in the key rate sooner rather than later. Keep in mind that the US currency stopped increasing last year just as inflation started to decline. Therefore, there is no chance that this report has anything to do with the strengthening of the euro. To put it more properly, the market was free to interpret it in any way it saw fit, which is likely exactly what it did. Once more, we witnessed the euro's growth without any justification.
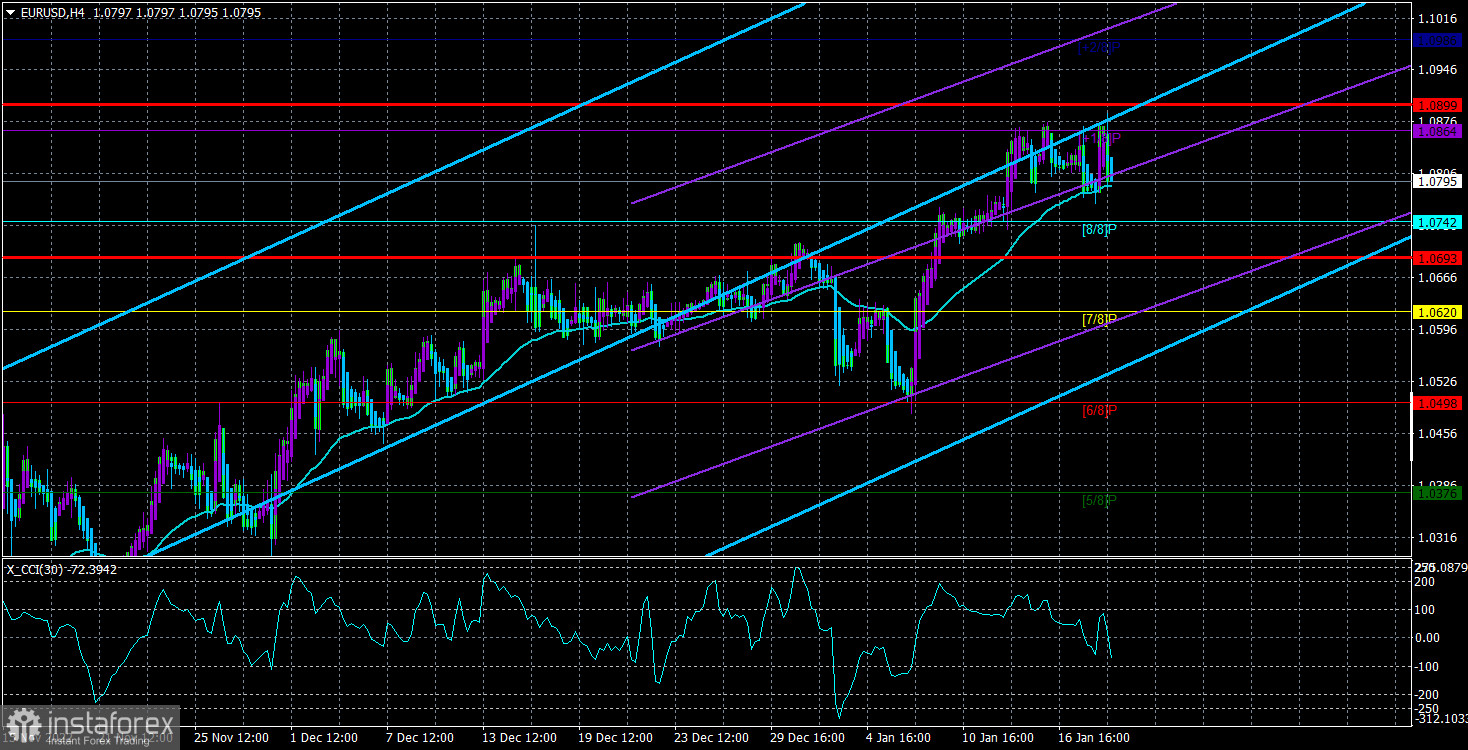
There is now no trading signal to sell, and a significant downward correction is still expected. Additionally, the more the euro appreciates, the more it will eventually decline as investors realize they may sell as well as buy. However, given that there are now no sell indications, we do not advise taking short positions. This week's three trading days have demonstrated that the sentiment of the market has not changed. It is still just interested in purchasing euros, so when it takes a pause, the bears are not strong enough to cause even a standard correction. Pay close attention to the 24-hour TF, which demonstrates unequivocally that the growth is now 1100 points, almost reversed. This distance is critical for the euro.
The head economist of the ECB thinks that rates ought to be higher. Nobody is debating.
This week's events included a speech by ECB head economist Philip Lane in addition to the completely useless inflation report. He offered no ground-breaking information in his address. Mr. Lane just mentioned that the rates naturally needed to be substantially higher than they are now. And it appears that the market took note of this development, cheering the addition of a new motive to buy. In reality, everyone is aware of the necessity for additional tightening of monetary policy and has done so for much longer than the first month. We do not dispute the length of the process required to tighten monetary policy, during which time the market can provide the necessary fundamental background. But how much longer will the euro's value increase based solely on the issue of declining rate divergence? Additionally, the rates from the Fed and ECB have not even begun to converge yet. The gap still exists, and the Fed will keep raising its rate; if the spread were twice as large, the euro would grow logically.
Even the market is aware of the rate increase that will take place in early February. By 0.25 percent in the United States (with a 90% chance) and by 0.5% in the European Union. It has also been known for a very long time that this is true. Remember that the euro's whole downward trend (the last one, as there have been several throughout the years) was 2800 points, taking 21 months to complete. In less than 4 months, the euro has now increased by 1,350 points. At this rate, all losses from the previous two years will be absorbed for another four to five months. In any scenario, the Fed rate will stay above the ECB rate for a considerable amount of time, even if there are unique underlying reasons for this. It is unclear whether the ECB will keep up its rate hike policy after boosting the rate by 1.25%. In general, we continue to think that the euro's strength is excessive but normal growth.
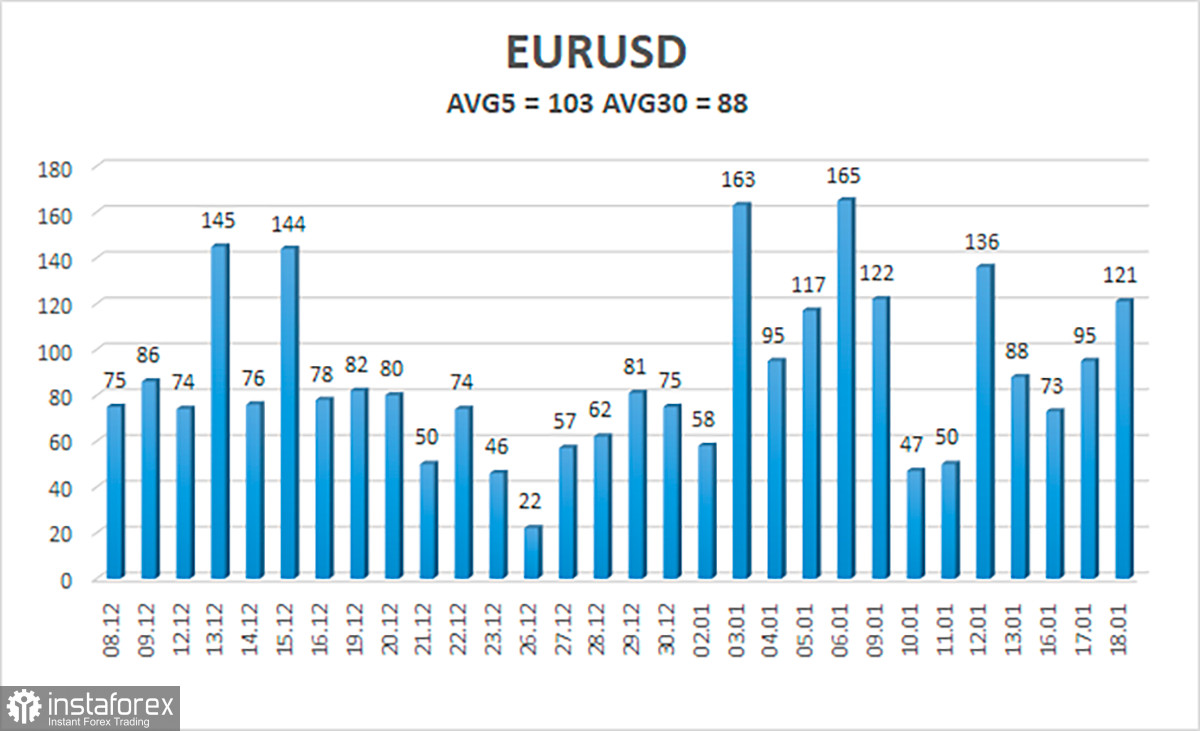
As of January 19, the euro/dollar currency pair's average volatility over the previous five trading days was 103 points, which is considered "high." So, on Thursday, we anticipate the pair to fluctuate between 1.0693 and 1.0899. The Heiken Ashi indicator will turn back up to signal the start of the upward movement.
Nearest levels of support
S1 – 1.0742
S2 – 1.0620
S3 – 1.0498
Nearest levels of resistance
R1 – 1.0864
R2 – 1.0986
Trading Suggestions:
A new micro pullback to the moving average has begun for the EUR/USD pair. In the event of an upward reversal of the Heiken Ashi indicator or a rebound from the moving average, we can currently consider opening new long positions with goals of 1.0864 and 1.0899. After putting the price below the moving average line, you may start opening short trades with goals of 1.0693 and 1.0620.
Explanations for the illustrations:
Determine the present trend with the use of linear regression channels. The trend is now strong if they are both moving in the same direction.
Moving average line (settings 20.0, smoothed): This indicator identifies the current short-term trend and the trading direction.
Murray levels serve as the starting point for adjustments and movements.
Based on current volatility indicators, volatility levels (red lines) represent the expected price channel in which the pair will trade the following day.
A trend reversal in the opposite direction is imminent when the CCI indicator crosses into the overbought (above +250) or oversold (below -250) zones.
Díky analytickým přehledům společnosti InstaForex získáte plné povědomi o tržních trendech! Jako zákazníkovi společnosti InstaForex je Vám k dispozici velký počet bezplatných služeb umožňujících efektivní obchodování.


