 Zůstat
Obchodní podmínky
Nástroje


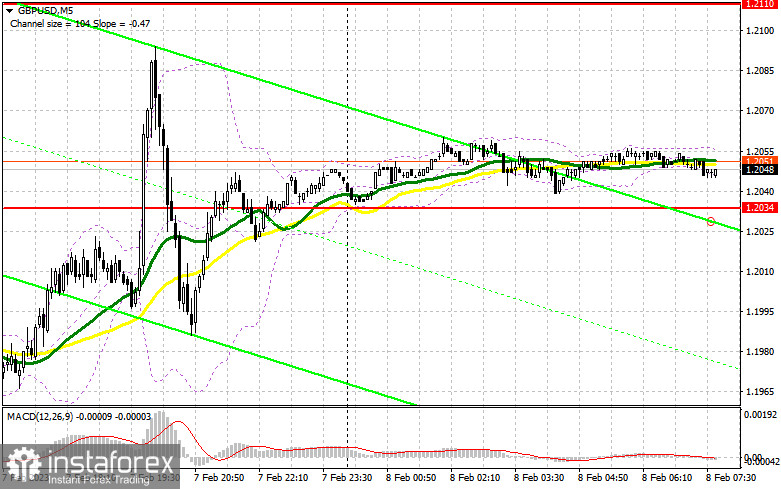
Yesterday, the pair formed only one entry signal. Let's see what happened on the 5-minute chart. In my morning review, I mentioned the level of 1.2012 as a possible point for entering the market. The price failed to break through 1.2012. Instead, it performed a downward retest of this level, thus generating a buy signal. Yet, I couldn't see any strong upward movement from there. After rising by 20 pips, the pair came under bearish pressure. There were no other signals in the second half of the day.
For long positions on GBP/USD:
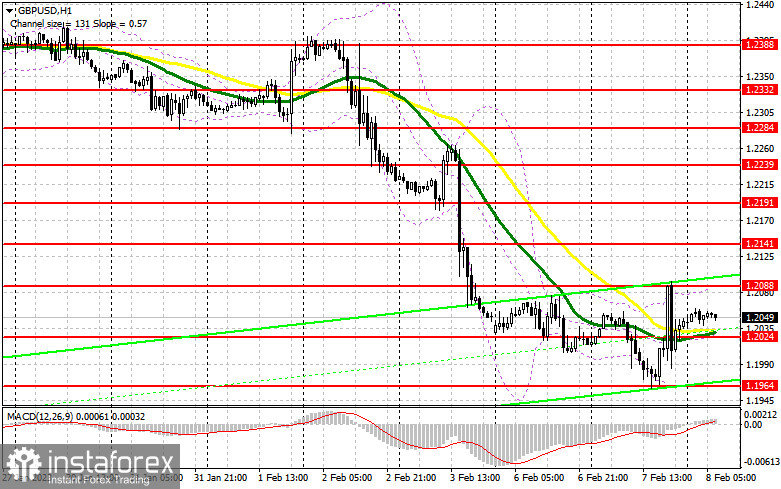
The pair stays in the sideways channel. Yesterday, the bulls made an attempt to leave the channel but Jerome Powell's comments limited their upside potential. The Fed Chair said it was necessary to keep raising interest rates until they hit the peak of 5.1% or even higher due to the situation in the US labor market. All this serves as support for the US dollar in the short term. Yet, the pound may well start an upward correction. As the macroeconomic background is quiet today, I will rely on technical analysis. If the pair declines, I may consider going long only after a false breakout at 1.202412. This is a new support level formed at the close of the day which also acts as a middle line of the sideways channel. The moving averages supporting the bulls are also found at this level which makes it possible for the pound to reach 1.2088. In case the pair settles above this level and tests it from top to bottom, I will expect its rapid surge to the high of 1.2141. A break above this range will pave the way for a higher target of 1.2191. However, this scenario may come true only amid new economic or political drivers. If bulls fail to push the price toward 1.2024, the bearish pressure on GBP/USD will increase. If so, I would recommend buying the pair only when the price hits the next support at 1.1964 and only after a false breakout. I will buy GBP/USD right after a rebound from 1.1881, keeping in mind an intraday correction of 30-35 pips.
For short positions on GBP/USD:
The fact that the pair has entered the sideways channel is good for the buyers. But as we can see, the sellers step in every time the pair attempts to break above 1.2088. Yesterday's statement by Jerome Powell gave them confidence but whether anyone is left at this level is not clear yet. Bears need to assert strength at this point as only a false breakout of 1.2088 will create a good entry point for going short. If so, the pair may develop a strong movement to 1.2024. A breakout and a downward retest of this range will cancel all bullish plans and a swift recovery from Friday's sell-off. This will intensify the bearish bias, and the next sell signal may lead the price to a lower boundary of the sideways channel at 1.1964. Its retest will confirm the formation of a new downtrend. The level of 1.1881 will serve as the lowest target, and the price may reach it only amid strong data from the US. This is where I'm going to take profit. If GBP/USD rises and bears are idle at 1.2088, bulls will be back in control of the market. In this case, only a false breakout of the next resistance at 1.2141 will give an entry point into short positions. If nothing happens there as well, I will sell GBP/USD right from the high of 1.2191, considering a possible pullback of 30-35 pips within the day.
COT report:
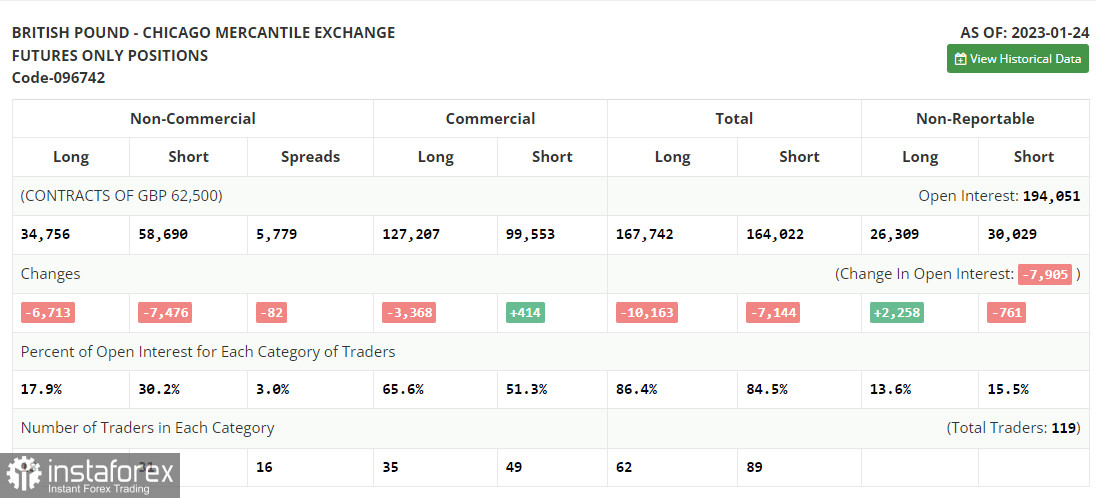
The Commitments of Traders report for January 24 recorded a sharp drop in both long and short positions. This decline was within acceptable values given the situation the UK government is currently dealing with. The UK authorities are facing strikes and demand for higher wages while trying to bring inflation lower. Still, our main focus should be on other things such as the Fed's meeting, which is expected to be less aggressive, and the meeting of the Bank of England. The latter is likely to maintain its hawkish stance and raise the rate by 0.5%. If so, the British pound will get strong support which is why I bet on its rise unless something unexpected happens. According to the latest COT report, short positions of the non-commercial group of traders decreased by 7,476 to 58,690 while long positions dropped by 6,713 to 34,756. As a result, the negative value of the non-commercial net position declined to -23 934 from -24 697 recorded a week ago. Such moderate changes do not change the market balance. So, we should continue monitoring the economic situation in the UK and the decisions of the BoE. The weekly closing price went up to 1.2350 from 1.2290.
Indicator signals:
Moving Averages
Trading above the 30- and 50-day moving averages indicates market uncertainty.
Please note that the time period and levels of the moving averages are analyzed only for the H1 chart, which differs from the general definition of the classic daily moving averages on the D1 chart.
Bollinger Bands
If the pair advances, the upper band of the indicator at 1.0845 will serve as resistance. In case of a decline, the lower band of the indicator at 1.0800 will act as support.
Description of indicators:
• A moving average of a 50-day period determines the current trend by smoothing volatility and noise; marked in yellow on the chart;
• A moving average of a 30-day period determines the current trend by smoothing volatility and noise; marked in green on the chart;
• MACD Indicator (Moving Average Convergence/Divergence) Fast EMA with a 12-day period; Slow EMA with a 26-day period. SMA with a 9-day period;
• Bollinger Bands: 20-day period;
• Non-commercial traders are speculators such as individual traders, hedge funds, and large institutions who use the futures market for speculative purposes and meet certain requirements;
• Long non-commercial positions represent the total number of long positions opened by non-commercial traders;
• Short non-commercial positions represent the total number of short positions opened by non-commercial traders;
• The non-commercial net position is the difference between short and long positions of non-commercial traders.
Díky analytickým přehledům společnosti InstaForex získáte plné povědomi o tržních trendech! Jako zákazníkovi společnosti InstaForex je Vám k dispozici velký počet bezplatných služeb umožňujících efektivní obchodování.


