 Zůstat
Obchodní podmínky
Nástroje


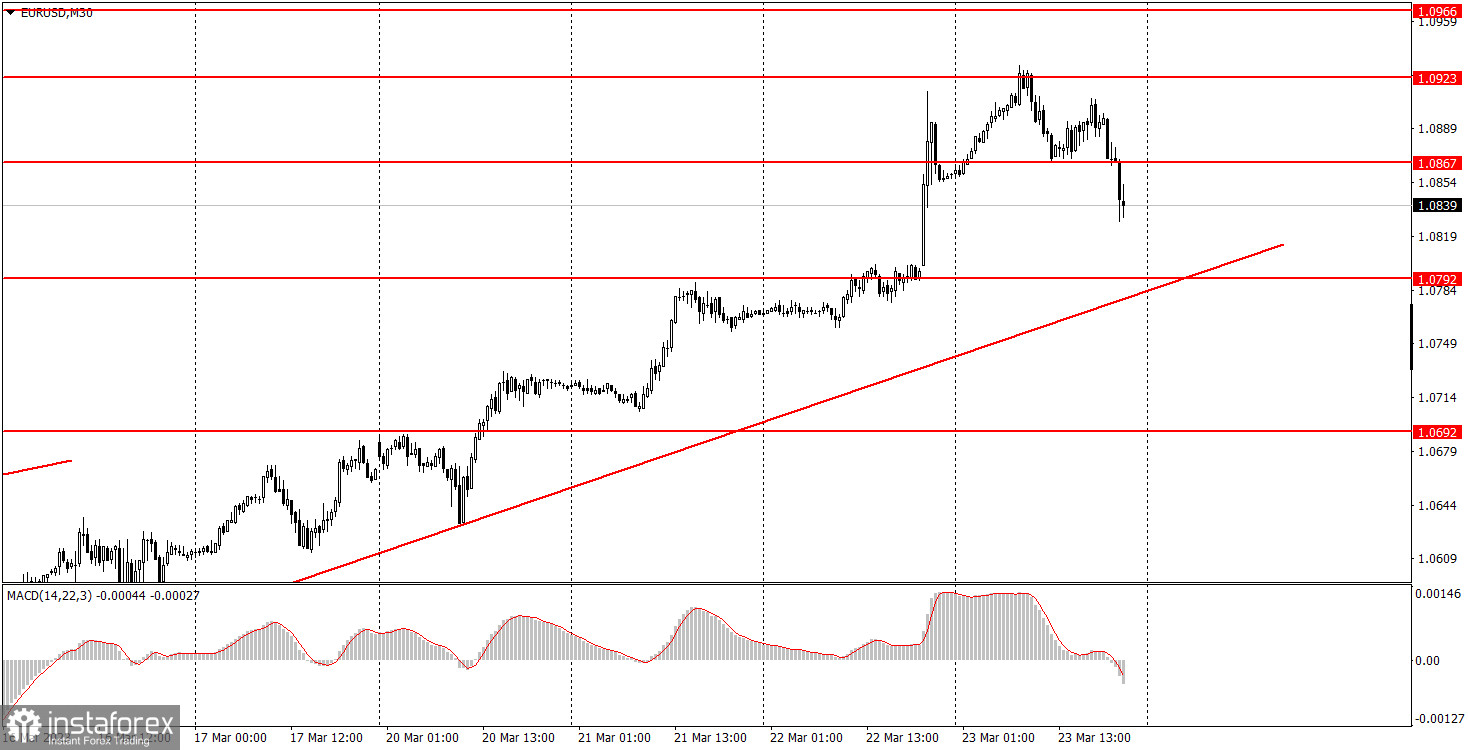
On Thursday, EUR/USD finally started to trade lower, which seems like a correction. The ascending trend line is still relevant, therefore, EUR may go back to rising again. There were no important events and reports in the European Union or the United States. That is why traders had nothing to react to, but they still chose to actively trade the EUR/USD pair, because the market was still under the impression of the results of the Federal Reserve meeting. By the way, the results were not important. Perhaps the only thing to take note of is Fed Chairman Jerome Powell's words that the rate hikes might be over soon. A few weeks ago, his rhetoric was the opposite. So until the price settles below the trend line, I don't expect the euro to sharply fall, but at the same time, I still hope that it does so eventually because its growth can't be justified.

Three very good trading signals were formed on the 5-minute chart. First, the pair rebounded from 1.0920-1.0933, and then it went down to 1.0857-1.0867, from which it also bounced. Here we should have closed short positions and opened longs. The profit on the shorts was about 30 points. Beginners failed to make profit on the longs, as the pair failed to reach the target level. However, the pair passed 20 points to the upside, so Stop Loss should have been set on Breakeven. The last sell signal appeared quite late and should not have been executed. As a result, the day was not the most profitable, but at least you could still gain a bit of profit.
On the 30-minute chart, the pair continues to form an uptrend, as evidenced by the ascending trend line. There was a very strong "foundation" this week, but it did not have a proper impact on the pair. The market just bought the euro, and sometimes it wasn't justifiable. I'm still waiting for the pair to fall. On the 5-minute chart, it is recommended to trade at the levels 1.0465-1.0483, 1.0535, 1.0587-1.0607, 1.0692, 1.0737, 1.0792, 1.0857-1.0867, 1.0920-1.0933, 1.0966, 1.0989. As soon as the price passes 15 pips in the right direction, you should set a Stop Loss to breakeven. On Friday, the European Union and the US will publish manufacturing and services PMIs. Not the most important reports. Also, the US will release its Durable Goods orders report, which is also not very important. Later in the evening, James Bullard of the Fed will give a speech.
1) The strength of the signal is determined by the time it took the signal to form (a rebound or a breakout of the level). The quicker it is formed, the stronger the signal is.
2) If two or more positions were opened near a certain level based on a false signal (which did not trigger a Take Profit or test the nearest target level), then all subsequent signals at this level should be ignored.
3) When trading flat, a pair can form multiple false signals or not form them at all. In any case, it is better to stop trading at the first sign of a flat movement.
4) Trades should be opened in the period between the start of the European session and the middle of the US trading hours when all positions must be closed manually.
5) You can trade using signals from the MACD indicator on the 30-minute time frame only amid strong volatility and a clear trend that should be confirmed by a trendline or a trend channel.
6) If two levels are located too close to each other (from 5 to 15 pips), they should be considered support and resistance levels.
Support and Resistance levels are the levels that serve as targets when buying or selling the pair. You can place Take Profit near these levels.
Red lines are channels or trend lines that display the current trend and show in which direction it is better to trade now.
The MACD indicator (14, 22, and 3) consists of a histogram and a signal line. When they cross, this is a signal to enter the market. It is recommended to use this indicator in combination with trend patterns (channels and trendlines).
Important announcements and economic reports that can be found on the economic calendar can seriously influence the trajectory of a currency pair. Therefore, at the time of their release, we recommend trading as carefully as possible or exiting the market in order to avoid sharp price fluctuations.
Beginners on Forex should remember that not every single trade has to be profitable. The development of a clear strategy and money management is the key to success in trading over a long period of time.
Díky analytickým přehledům společnosti InstaForex získáte plné povědomi o tržních trendech! Jako zákazníkovi společnosti InstaForex je Vám k dispozici velký počet bezplatných služeb umožňujících efektivní obchodování.


