 Zůstat
Obchodní podmínky
Nástroje


The data on the UK lending market did not please.
The number of approved mortgages in February was 43,500, slightly higher than the 39,600 last month. This is the only positive thing in the report. Mortgage lending fell to £0.74 billion compared to £2.0 billion in the previous month. Consumer lending also fell to £1.4 billion, down from £1.6 billion. The volume of net loans to individuals also declined.
Note that mortgage lending is directly related to the real estate market, which is an important sector of the British economy.
During the American trading session, the index of pending sales in the U.S. real estate market for February was published, which rose 0.8% against a forecasted decline of 2.3%.
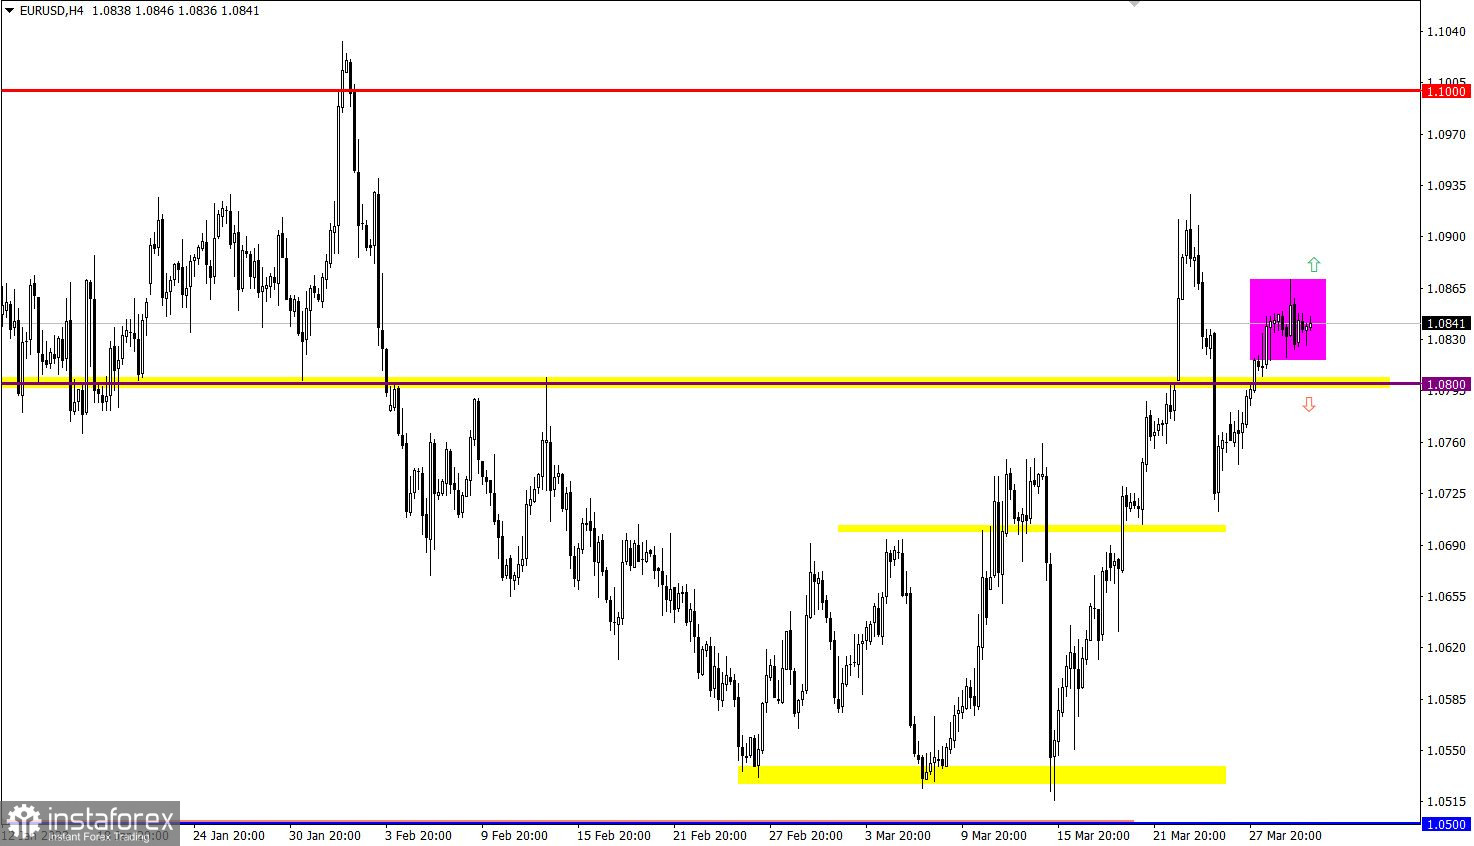
EUR/USD slowed down when it reached 1.0870, which resulted in the market stagnation. As a result, a consolidation range of 50 pips was formed. It is possible that the current slowdown is a process of accumulation of trading forces, which will lead to an acceleration of the market in the future.
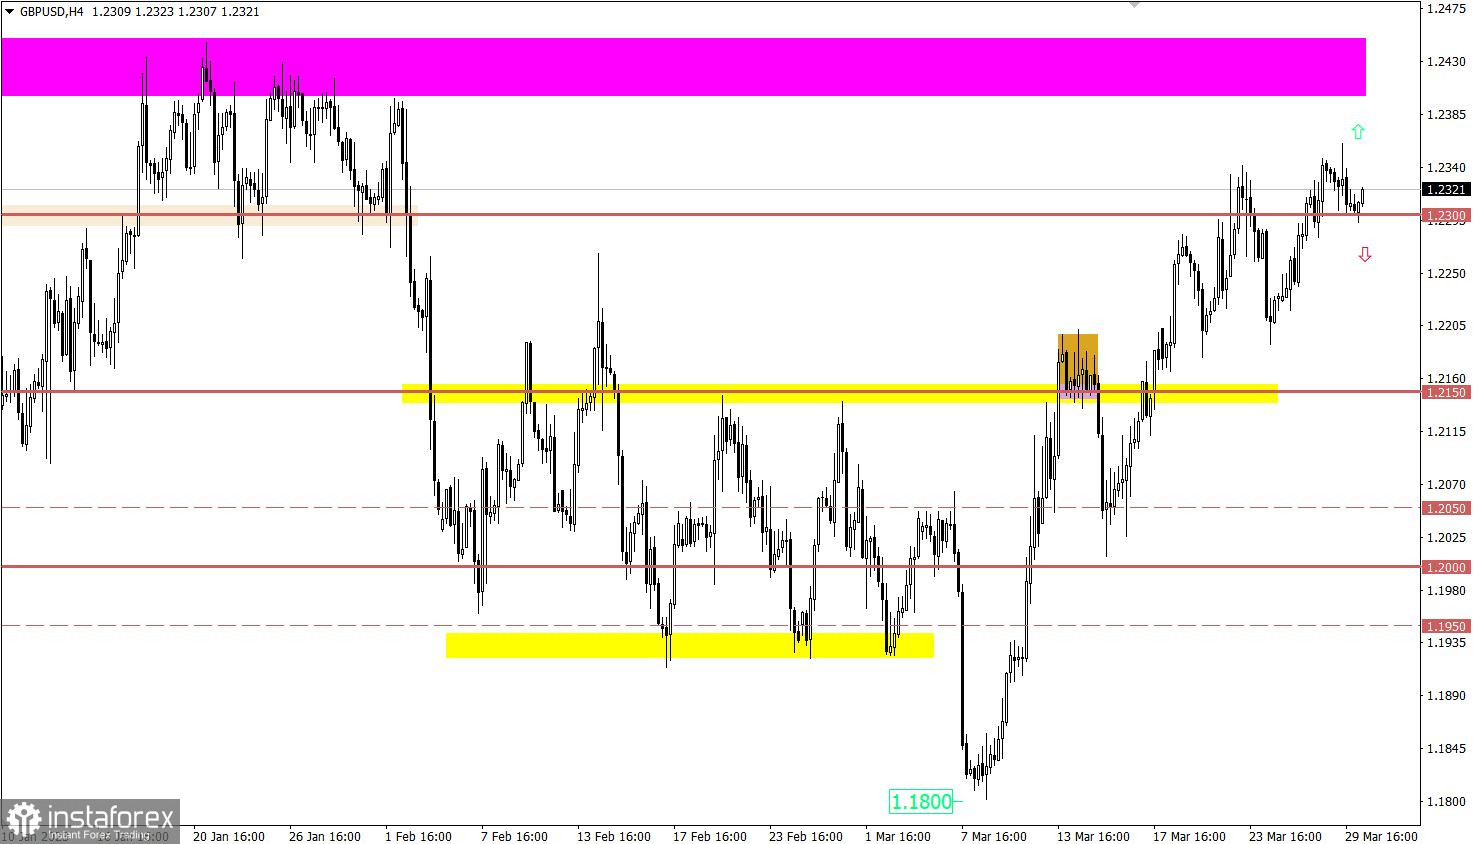
GBP/USD pulled back slightly after reaching the local high of the week. The level of 1.2300 became a support for the market, and the volume of short positions has decreased relative to it.

Weekly data on jobless claims in the United States is expected to be released today, with the overall rate forecast to rise. This is a negative factor for the U.S. labor market.
Statistics details:
The volume of continuing claims for benefits may rise from 1.694 million to 1.697 million.
The volume of initial claims for benefits may rise from 191,000 to 196,000.
The release of the U.S. GDP data, which growth rate is estimated to slow down from 1.9% to 0.9%, will play a key role in today's events. However, final figures are already priced in. Therefore, in case they coincide with the actual data, there will be no reaction in the market.
Time targeting:
U.S. Jobless Claims – 13:30 UTC
U.S. GDP – 13:30 UTC
The most optimal tactic is the outgoing momentum method from the current stagnation range, which is 1.0720/1.0870. This method can lead to a technical signal about the subsequent direction of the market.
If the price holds above the level of 1.0870, an upward scenario is possible, which implies the continuation of the current cycle. In this case, traders are looking for last week's high.
If the price starts to decline, a downward scenario is possible, which will lead to a price drop below the level of 1.0800.
If the price holds steady above the 1.2300/1.2350 range, it is highly likely to continue rising in the future. In this case the price may move towards the local high of the medium-term upward trend.
However, note that if the price returns below the 1.2300 level during the daily period, it may lead to a more significant price decline compared to the current pullback.
The candlestick chart type is white and black graphic rectangles with lines above and below. With a detailed analysis of each individual candle, you can see its characteristics relative to a particular time frame: opening price, closing price, intraday high and low.
Horizontal levels are price coordinates, relative to which a price may stop or reverse its trajectory. In the market, these levels are called support and resistance.
Circles and rectangles are highlighted examples where the price reversed in history. This color highlighting indicates horizontal lines that may put pressure on the asset's price in the future.
The up/down arrows are landmarks of the possible price direction in the future.
Díky analytickým přehledům společnosti InstaForex získáte plné povědomi o tržních trendech! Jako zákazníkovi společnosti InstaForex je Vám k dispozici velký počet bezplatných služeb umožňujících efektivní obchodování.


