 Zůstat
Obchodní podmínky
Nástroje


During the third trading day of the week, the EUR/USD currency pair showed incomprehensible movements, best described as "flat." If you look at the hourly TF, the signs of the flat are also present. The pair still cannot correct well downward, although it has no factors to stay that high either. In general, the market situation needs to be revised, and it is extremely difficult to predict the further movement of the pair. At any moment, it can collapse downward due to its overbought condition and the unjustified position so high. Yesterday in the European Union, the final report on inflation for March was published. Its value fully coincided with the forecasts, so no reaction followed. Volatility during the day was low.
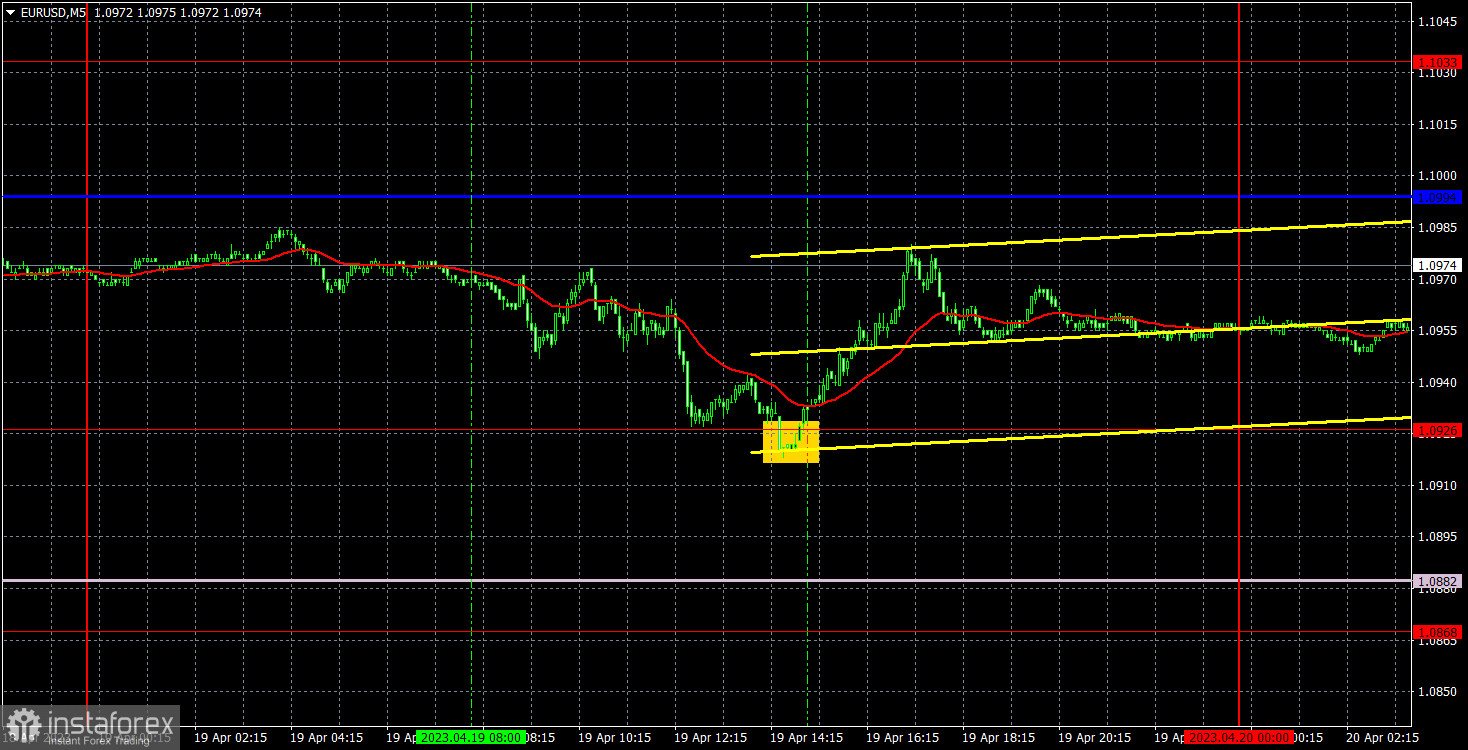
Only one trade signal was formed – a rebound from the level of 1.0926 at the beginning of the American trading session. After forming this signal, the price went up about 25-30 points, which traders could earn. The deal had to be closed manually, as the pair could not reach the nearest levels and lines by the end of the day. Despite the flat and weak volatility, it was still possible to make a small profit. The Ichimoku indicator lines are fixed, as in flat; they merge and form false signals.
EUR/USD analysis 1H.
On the hourly timeframe, the pair maintains an upward trend, as evidenced by its position above the trend line and the Senkou Span B line. Despite the strong decline on Friday and Monday, nothing has changed technically so far. It is still very difficult for the dollar to show growth, which is strange and surprising, as there are no strong reasons for the euro to rise. On Thursday, we highlight the following levels for trading – 1.0658-1.0669, 1.0762, 1.0806, 1.0868, 1.0926, 1.1033, 1.1076, 1.1137-1.1185, 1.1234, 1.1274, as well as the Senkou Span B line (1.0882) and the Kijun-sen line (1.0994). The lines of the Ichimoku indicator can move during the day, which should be considered when determining trade signals. There are also auxiliary support and resistance levels, but no signals are formed around them. Signals can be "rebounds" and "breakouts" of extreme levels and lines. Don't forget to set a Stop Loss order at breakeven if the price moves in the right direction by 15 points. This will protect against potential losses if the signal turns out to be false. On April 20, no important events or publications are scheduled in the European Union and the United States. Of course, you can pay attention to jobless claims or new home sales in the US, but these are not the publications that can cause a strong market reaction. Or at least some reaction. Now we can say that the pair continues to trade in a flat with minimal Volatility.
Explanations for the illustrations:
Support and resistance levels - thick red lines around which movement can end. They are not sources of trading signals.
Kijun-sen and Senkou Span B lines - lines of the Ichimoku indicator transferred to the hourly timeframe from the 4-hour timeframe. They are strong lines.
Extreme levels - thin red lines from which the price previously rebounded. They are sources of trading signals.
Yellow lines - trend lines, channels, and other technical patterns.
Indicator 1 on COT charts - the size of the net position for each category of traders.
Indicator 2 on COT charts - the size of the net position for the "Non-commercial" group.
Díky analytickým přehledům společnosti InstaForex získáte plné povědomi o tržních trendech! Jako zákazníkovi společnosti InstaForex je Vám k dispozici velký počet bezplatných služeb umožňujících efektivní obchodování.


