 Zůstat
Obchodní podmínky
Nástroje


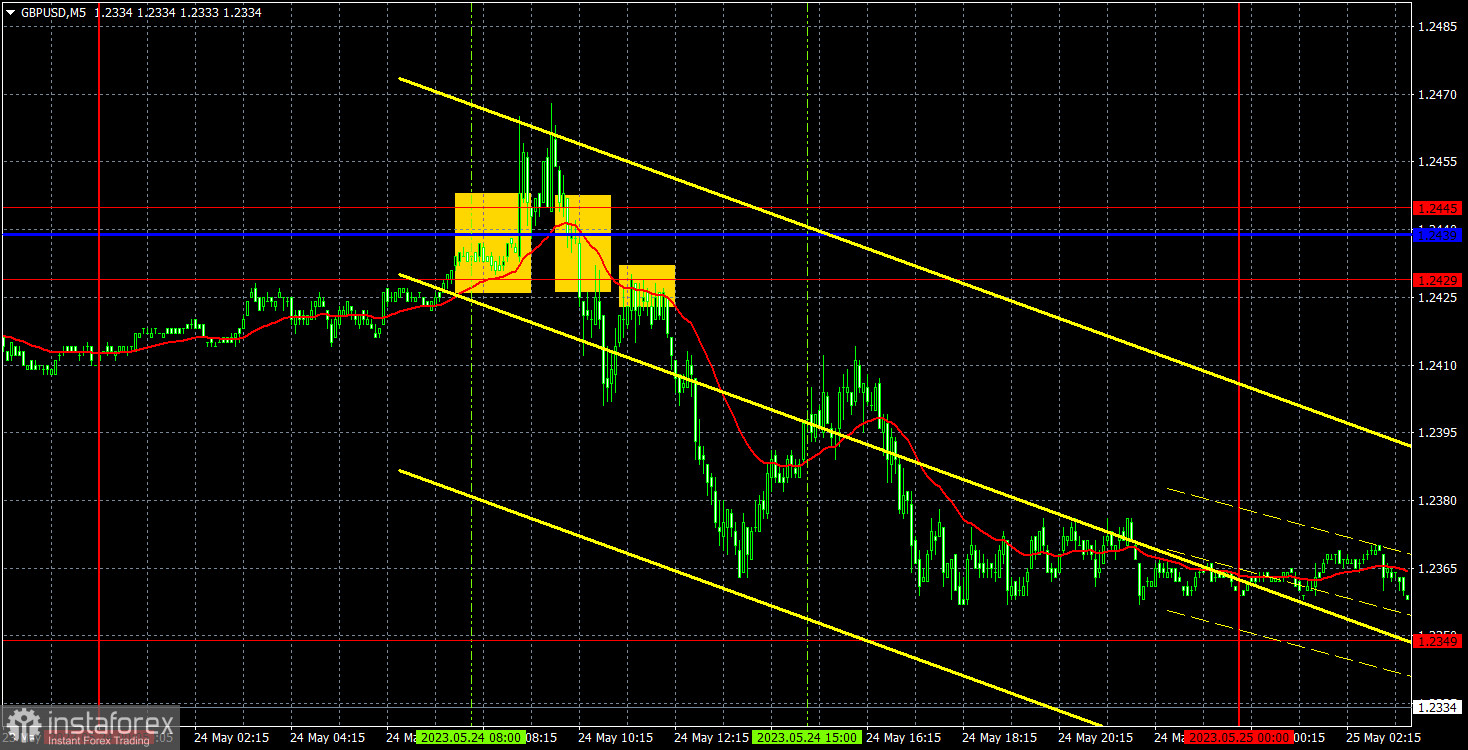
On Wednesday, GBP/USD showed significant volatility, with the pair trading more than 100 pips. Of course, the market's emotional surge was triggered by important macroeconomic news, specifically the UK inflation report. I completely agree with the market, which continues to sell the overbought and undeservedly strengthened pound. Besides the inflation report, there was another speech by Bank of England Governor Andrew Bailey, but his rhetoric on Wednesday was not much different from Tuesday.
There were only three trading signals. The first one, a buy signal, emerged when the pair surpassed the 1.2429-1.2445 range. And this occurred precisely when the inflation report was released. It should have been ignored since the pair could have moved in either direction. The next sell signal was a breakthrough of the same range but this time the pair fell, which could have been executed with a short position. The third sell signal was a rebound from 1.2429, which duplicated the second signal. In this case, it was simply a matter of staying in short positions. As a result, the pair fell by around 60 pips and there were no more signals for the rest of the day. Therefore, the trade should have been manually closed closer to the evening. You could gain around 60 pips of profit.
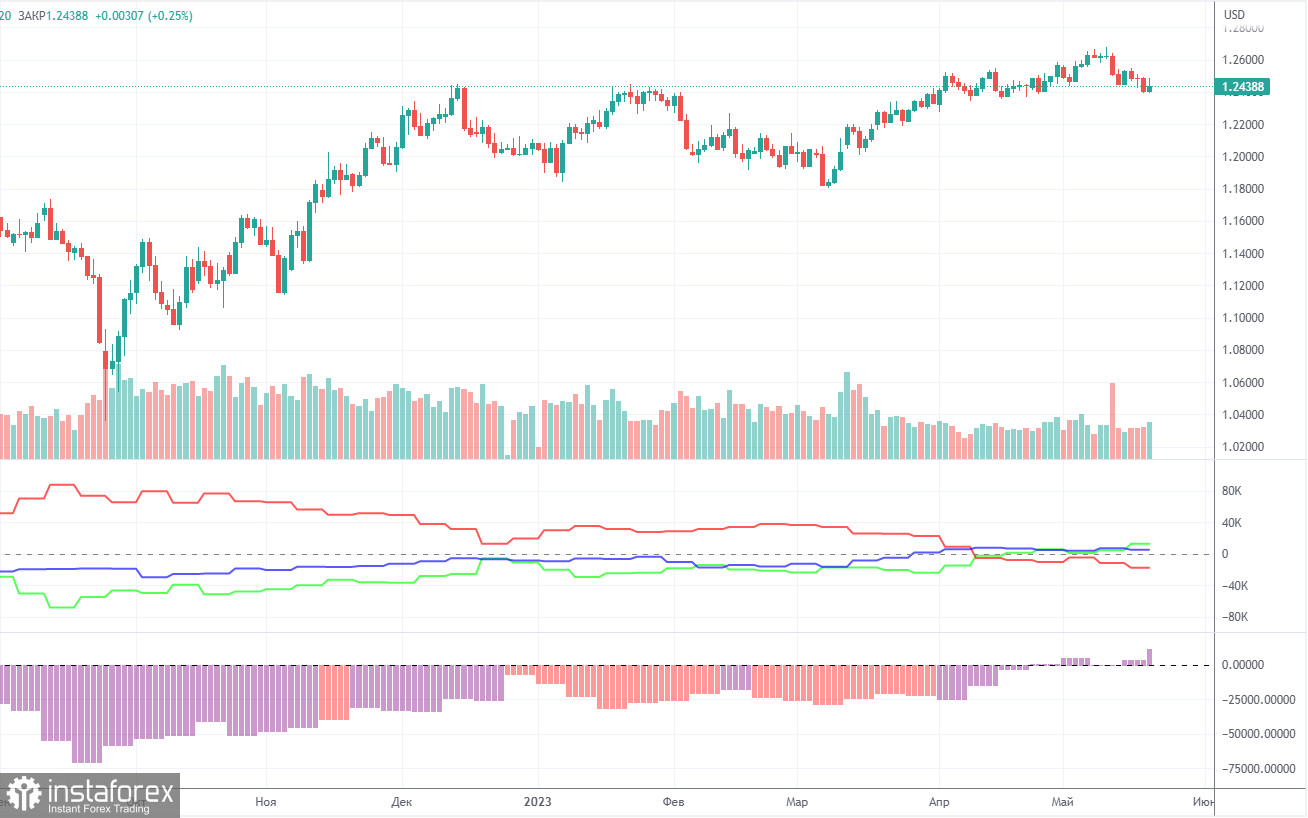
According to the latest report, non-commercial traders opened 5,800 long positions and closed 2,200 short ones. The net positions grew by 8,000 and remained bullish. Over the past 9 months, the net position has been on the rise despite bearish sentiment. The pound is bullish against the greenback in the medium term, and fundamentals hardly explain that. We do not rule out a possibility of a fall in the near term. In fact, it may have already begun.
Both major pairs are in correlation now. At the same time, the positive net position on EUR/USD indicates an impending reversal. Meanwhile, the neutral net position on GBP/USD illustrates a bullish continuation. The pound has gained about 2,300 pips. Therefore, a bearish correction is now needed. Overall, non-commercial traders hold 64,800 sell positions and 77,400 long ones. We do not see the pair extending growth in the long term.
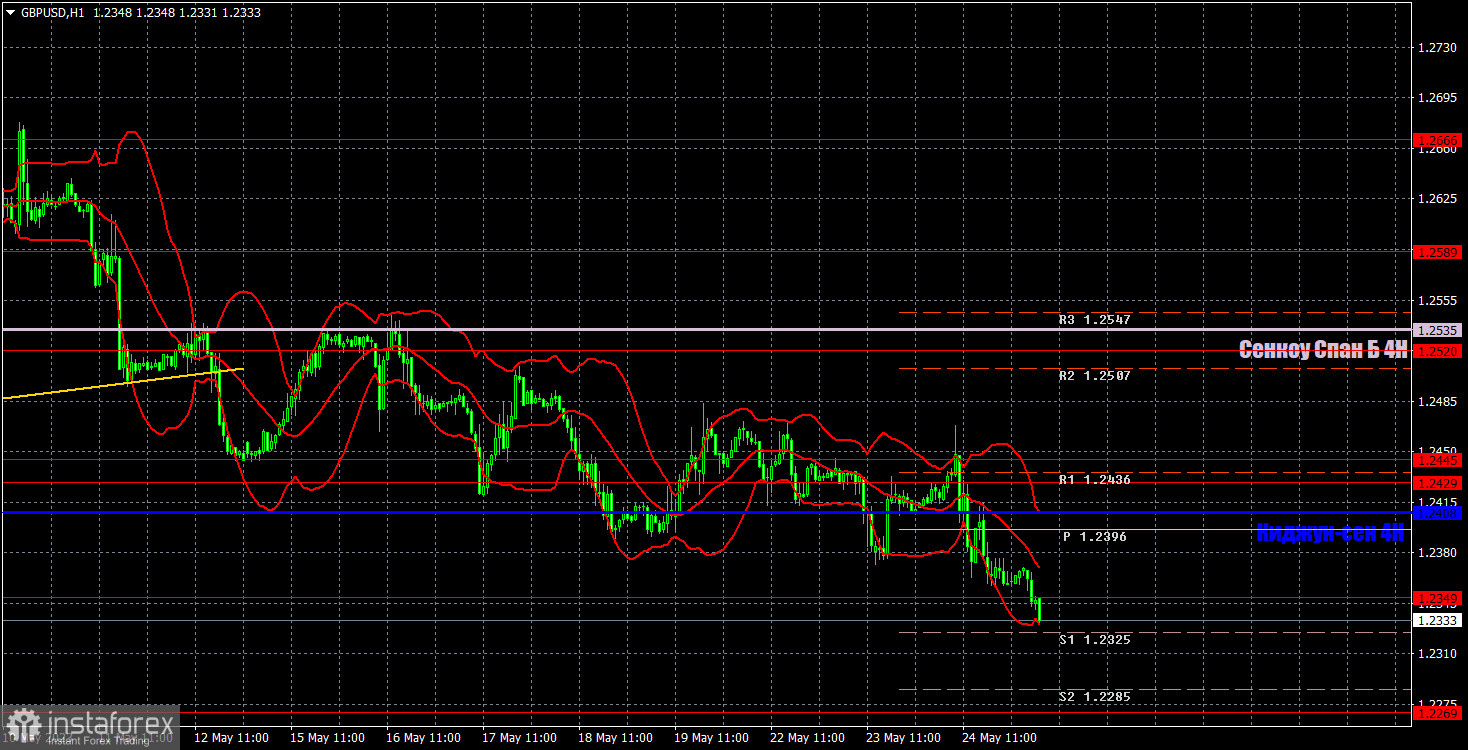
In the 1-hour time frame, the pair has breached the ascending trendline. The bearish movement persists. The price is below all the lines of the Ichimoku indicator, which allows us to be hopeful about the downtrend. I believe that the pair should extend its downward movement. The UK macro data continue to be less than favorable, providing another reason to sell the pound.
On May 25, trading levels are seen at 1.2188, 1.2269, 1.2349, 1.2429-1.2445, 1.2520, 1.2589, 1.2666. The Senkou Span B line (1.2535) and the Kijun-sen line (1.2408) may also generate signals when the price either breaks or bounces off them. A Stop Loss should be placed at the breakeven point when the price goes 20 pips in the right direction. Ichimoku indicator lines can move intraday, which should be taken into account when determining trading signals. There are also support and resistance which can be used for locking in profits.
There are no important events scheduled in the UK on Thursday. In the US, there will be reports on GDP and jobless claims, which are considered relatively minor in importance. There will also be several speeches by representatives of the Bank of England and the Federal Reserve, of which we have seen and heard a lot lately. In general, the market already has a good understanding of what to expect from central banks.
Resistance/support - thick red lines, near which the trend may stop. They do not make trading signals.
The Kijun-sen and Senkou Span B lines are the Ichimoku indicator lines moved to the hourly timeframe from the 4-hour timeframe. They are also strong lines.
Extreme levels are thin red lines, from which the price used to bounce earlier. They can produce trading signals.
Yellow lines are trend lines, trend channels, and other technical patterns.
Indicator 1 on the COT chart is the size of the net position of each trader category.
Indicator 2 on the COT chart is the size of the net position for the Non-commercial group of traders.
Díky analytickým přehledům společnosti InstaForex získáte plné povědomi o tržních trendech! Jako zákazníkovi společnosti InstaForex je Vám k dispozici velký počet bezplatných služeb umožňujících efektivní obchodování.


